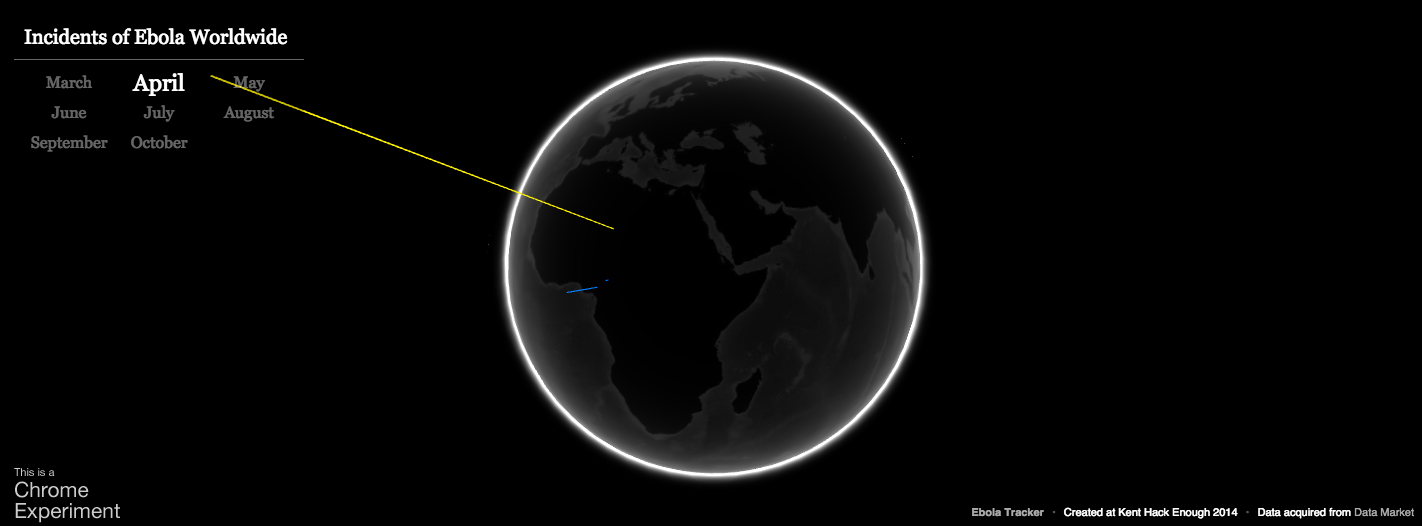
I wanted to visualize how Ebola was spreading across the globe. So I set out to do this during Kent Hack Enough and learned some amazing things in the process.
The first things I learned were technology based. I found a mentor through American Greetings who helped me pull live data and begin to analyze it. Then we had to write javascript to sort this data and convert it to JSON format so it could be interpreted. Some research about global data visualizations turned up a Chrome Experiment using Web GL. This suited my needs perfectly.

Log in or sign up for Devpost to join the conversation.