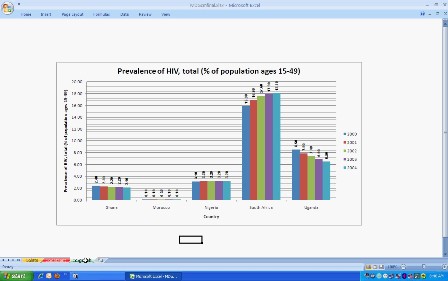
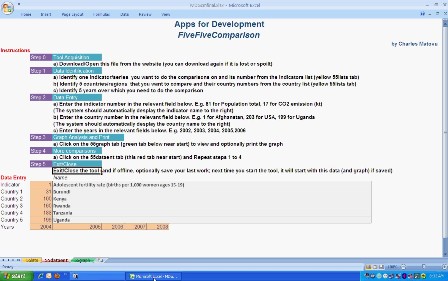
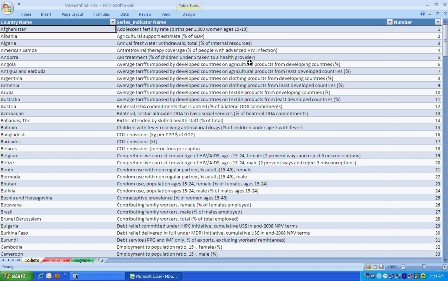
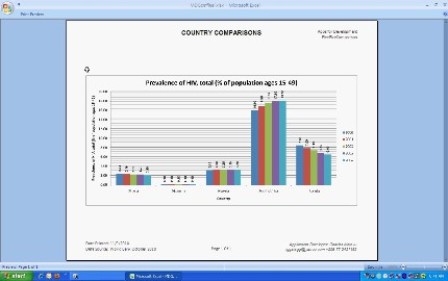
Description FiveFiveComparison helps you to compare performance of any five countries over a period of any five years on any one selected MDG performance indicator. It allows you to select the indicator, the five countries, and the five years. Basing on the selection, FiveFiveComparison produces a graph that visually shows the performance of these selected countries on the chosen indicator side by side and the trend over the selected years. Target Audience FiveFiveComparison is designed for and can be used by any development stakeholder including but not limited to politicians, technocrats, researchers, scholars and ordinary citizens. Objective FiveFiveComparison aims at arousing your interest and awareness of how various countries are performing on various indicators, motivating you to find out how and why, propel you to identify the lessons learnt and strategies that could be applied from one country to another to better the world, and make you take action. Advantages FiveFiveComparison is simple to use; does not require acquisition and installation of complex computer hardware and software; can be run both offline and online thus usable in countries with internet challenges; can be easily moved from computer to computer using simple single storage devices like CDs, flash disks, and even diskettes; and it does not require complex computer skills to use – requires only ability to follow the 5 steps instructions. The application works on any computer running MS Excel 2007. Technical Information The application is technically designed using MS excel (utilizing the World Bank MDG.xlsx data dated 1st October) and will run on any computer running MS Excel (preferably the 2007 version). It can be easily modified (with some extra MS Excel skills) to be used on older versions of MS Excel (and possibly other spreadsheets), utilize other different and future performance data, and include controls and security. Usage Instructions Step 1 Data identification. Identify 1 indicator, 5 countries to compare and the 5 years over which to do the comparison. This is done by noting down their respective numbers from the 55lists (yellow tab). The countries and indicators are alphabetically arranged and numbered. Step 2 Data entry. Enter the numbers for the indicator and the 5 countries, together with the selected years in the data entry screen (the orange boxes). As numbers are entered, the application automatically displays the names. Step 3 Graph Analysis and printing. Click on the green 55graph tab. This displays the graph which can be printed. Step 4 Do more comparison. This is simply repeating steps 2 though 4. Step 5 Close/Exit the application. Close the normal way that an MS Windows application is closed. An option to save is available
FiveFiveComparison
Updates

Leave feedback in the comments!
Log in or sign up for Devpost to join the conversation.