


Inspiration
I'm currently running a very large & heavily distributed Splunk installation. We're constantly on the lookout for ways to expand our installation in both bare-metal upgrades & now cloud providers. However there wasn't a good way for me to be able to test or measure the capacity of these systems to see if they would work at our production loads. I started out writing a few scripts that measured the load on the system and started throwing the data into Splunk as a quick & dirty report. Over time this got more detailed & now it's a complete package of tools that runs as a single application.
How it works
Gladiator works by doing a few different things simultaneously.
- Creates index load on a system by use of a python script that buffers data into memory before it's sent of to be indexed. The rate that data is written can be scaled up or down by simply changing the size of a dictionary file (full of random data). The data then get's randomized & time-date stamped so that there is a constant stream of data being indexed instead of a batch process. This simulates a steady stream of data coming into a Splunk indexer as it's not the same dataset sent to be indexed each time.
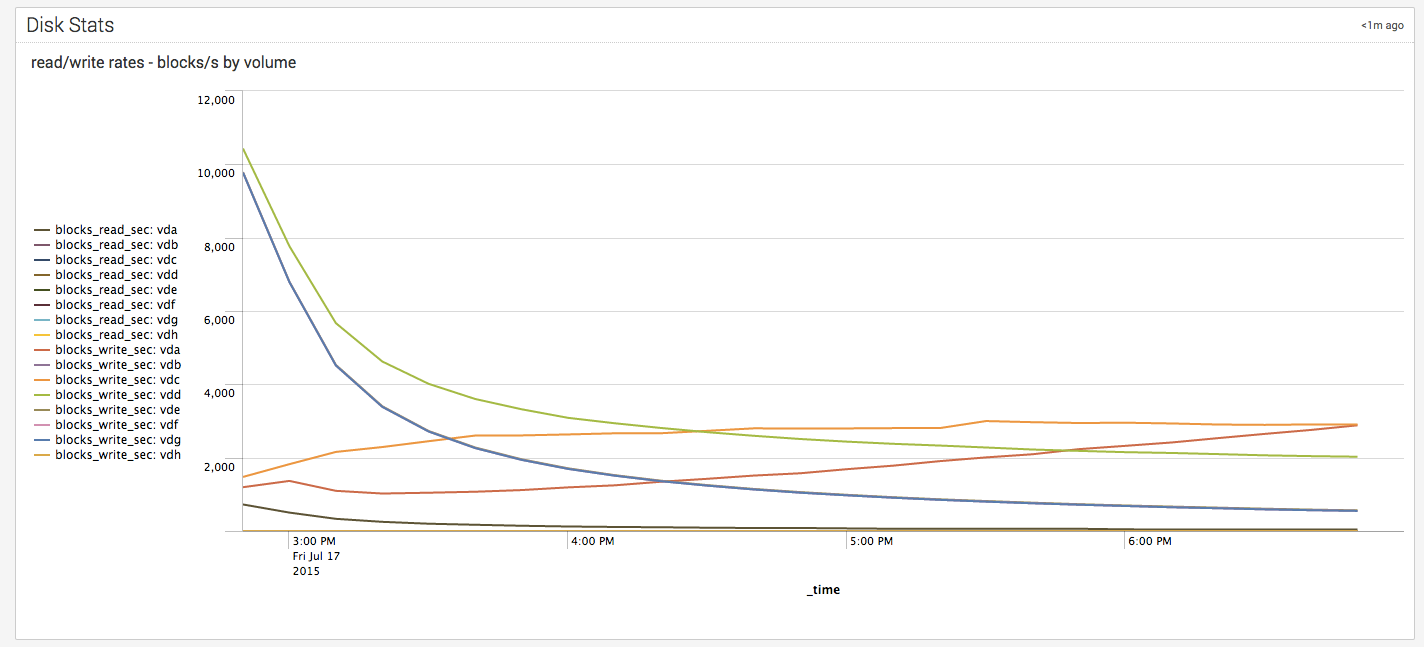
- Collection of python & shell wrappers measure the performance of the system. Gladiator collects sar stats, iostats, vmstats & other system level information & writes that data to an internal Splunk index so all performance related data is collected in one location.
- Gladiator comes with a search load generator script that will search through the data being indexed at a configurable searches/minute rate. The search engine uses a randomizer that changes the time frame of the data searched as well as the alpha character it is searching for. This creates random read/IO on the system that simulates a user work load.
- Finally Gladiator ties it all together in one "single pane of glass". All reports are available on 1 dashboard so you can see memory load, disk/IO and CPU utilization all at the same time.
Challenges I ran into
This was a lot more coding than I'm used to, although I hate to admit it I'm more of a manager these days. Originally Gladiator was broken into 4 different components that all worked independently. It was a lot of work, but I was able to bring it all together under a complete app that can deployed and running in minutes.
Accomplishments that I'm proud of
I'm proud that I was able to start with concept of just "let's measure this stuff" & be able to bring all the pieces of it together into 1 tool that can produce useful reports that can accurately measure how a system is expected to perform under production loads. It's exciting to bring a vague collection of ideas & now have a tangible tool that can be used.
What I learned
How to be flexible & a lot about disk/IO.
What's next for Gladiator
Converting the collection of shell & python scripts from wrappers into python to be more cross-compatible. Converting the collection of macros that are being used now to a data model.


Log in or sign up for Devpost to join the conversation.