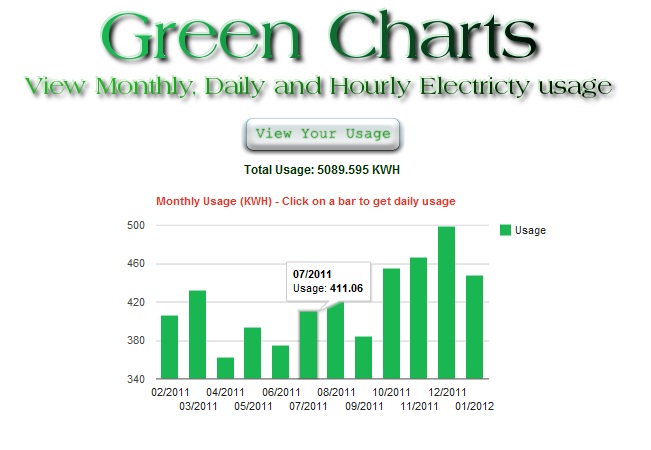
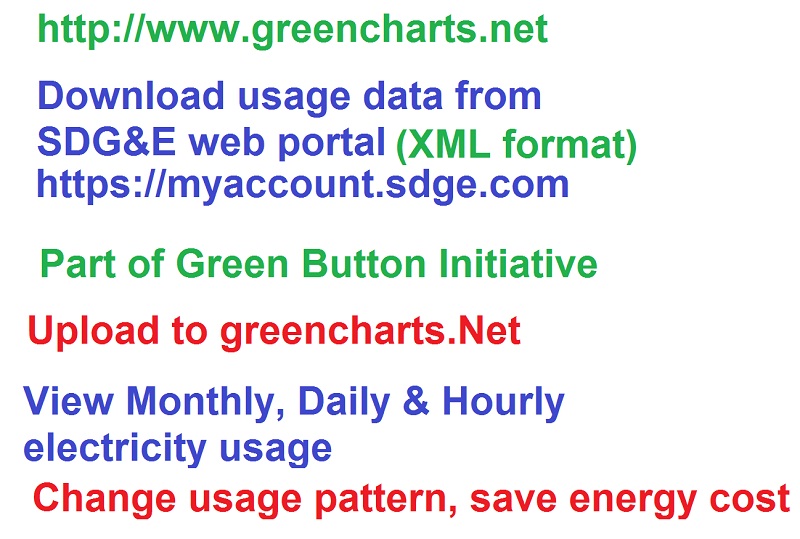
View and compare Monthly, Daily and Hourly Electricity usage using interactive charts.
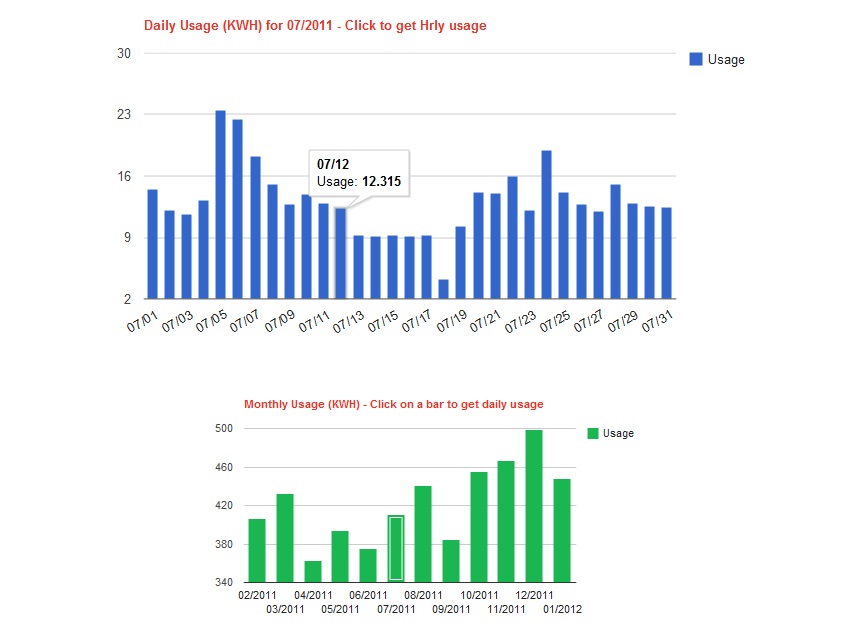
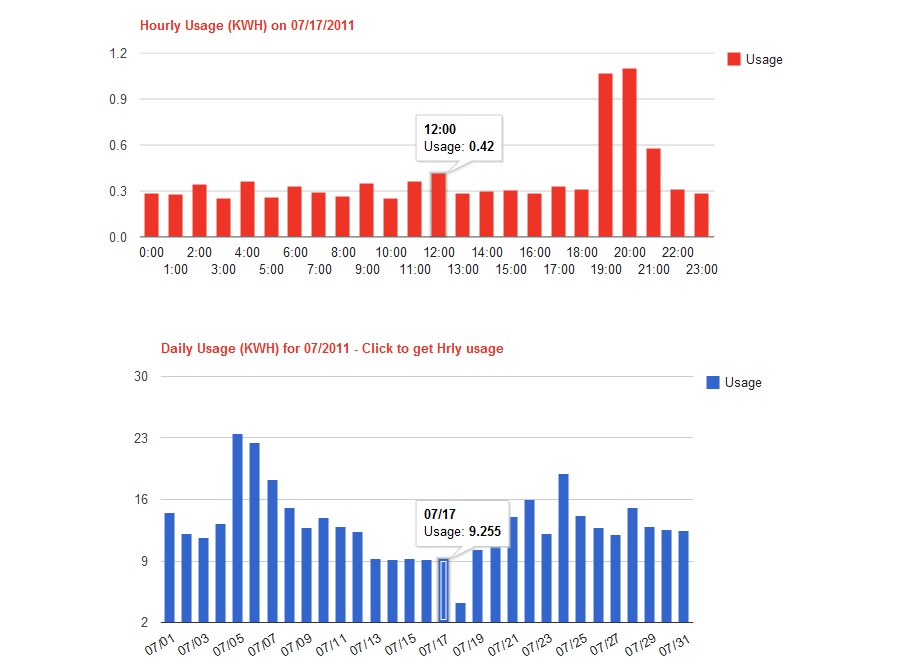
Initially shows monthly usage using green bar chart. Hover over the bars to view monthly consumption. Click on a bar to view daily consumption using blue bar chart. Clicking on a daily bar will display hourly consumption using red bar chart.
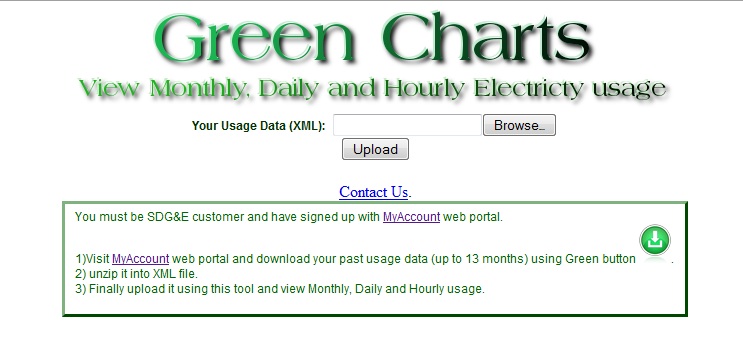
Uses data provided by SDG&E in response to the Green Button initiative launched by USA Government. If you are an SDG&E customer, download your consumption data from SDG&E MyAccount portal in XML format, unzip it and upload to Green Charts!.
Uses client side processing for improved, fast user experience. Adjust your usage pattern, for example, by using your dryer in the evening. Start saving energy and your electricity bill. Go green!
Also works with PG&E data.

Log in or sign up for Devpost to join the conversation.