

Are you having a hard time measuring the performance of your Infusionsoft Application? Well, you're not alone. Many Infusionsoft users are clueless as to the conversion and overall effectiveness of the funnels and sales processes they build with Infusionsoft.
It's been said for more than a century now, that , "A Picture is Worth a Thousand Words." This couldn't be more true than it is when trying to assimilate reports and results in Infusionsoft.
Stop staring at tables of numbers for hours on end. Understanding the performance of your business shouldn't be guess work and it certainly shouldn't be hard work either. With Maven Analytics, you can tell if things are trending up or down with a single glance.
Maven Analytics provides end users with visual charts, graphs and reports of their Infusionsoft data. These bar graphs, line graphs and pie charts equip business leaders with actionable data that leads to increasing their net profit.
Easily pin point leadsources with high conversions and profitability. Ditch leadsources that aren't making the cut and allocate those funds into higher producing advertising mediums.
Calculate Your Value Per Send. How would you like to know how much money each and every email is producing for you? Track and identify the final "click" that pushed the person to purchase.
User Defined Report Criteria Flexible reports allow you to determine which data points you want to look at and for what date range you wish to view.
In addition to Infusionsoft's native reports, view graphical representations of custom API reports we've developed, combining the most crucial and relevant information small business owners should know. Want to grow your business? You first need to have a clear picture of past performance and a solid feel for current performance in order to achieve the results you desire in future performance.
Current Reports Included:
- New Leads
- New Leads By Lead Source
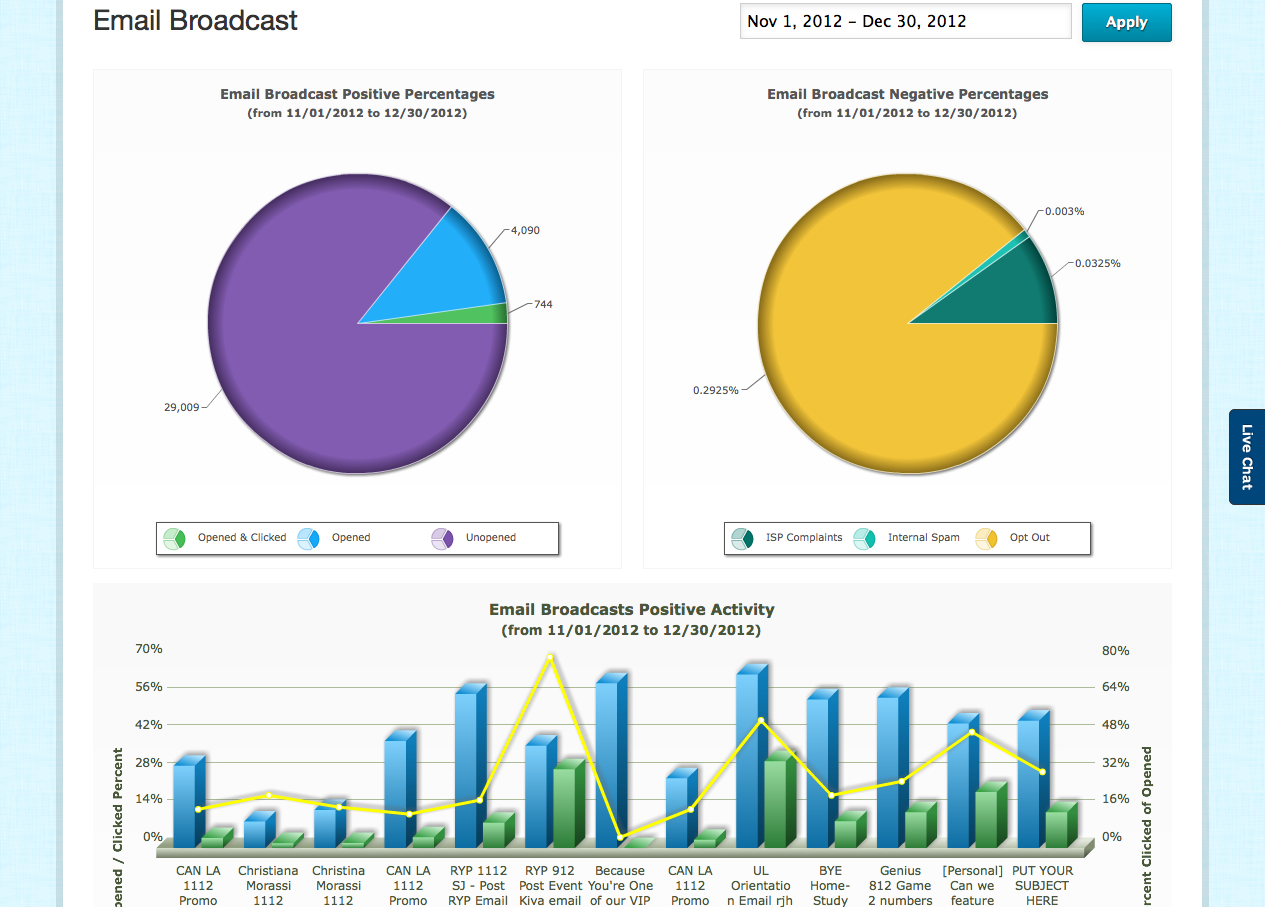
- Email Broadcast Positive Percentages
- Email Broadcast Negative Percentages
- Email Broadcast Positive Activity
- Email Broadcast Revenue Totals
- Email Broadcast - Value Per Send
- Email Broadcast - Value Per Opened
- Email Broadcast - Negative Activity
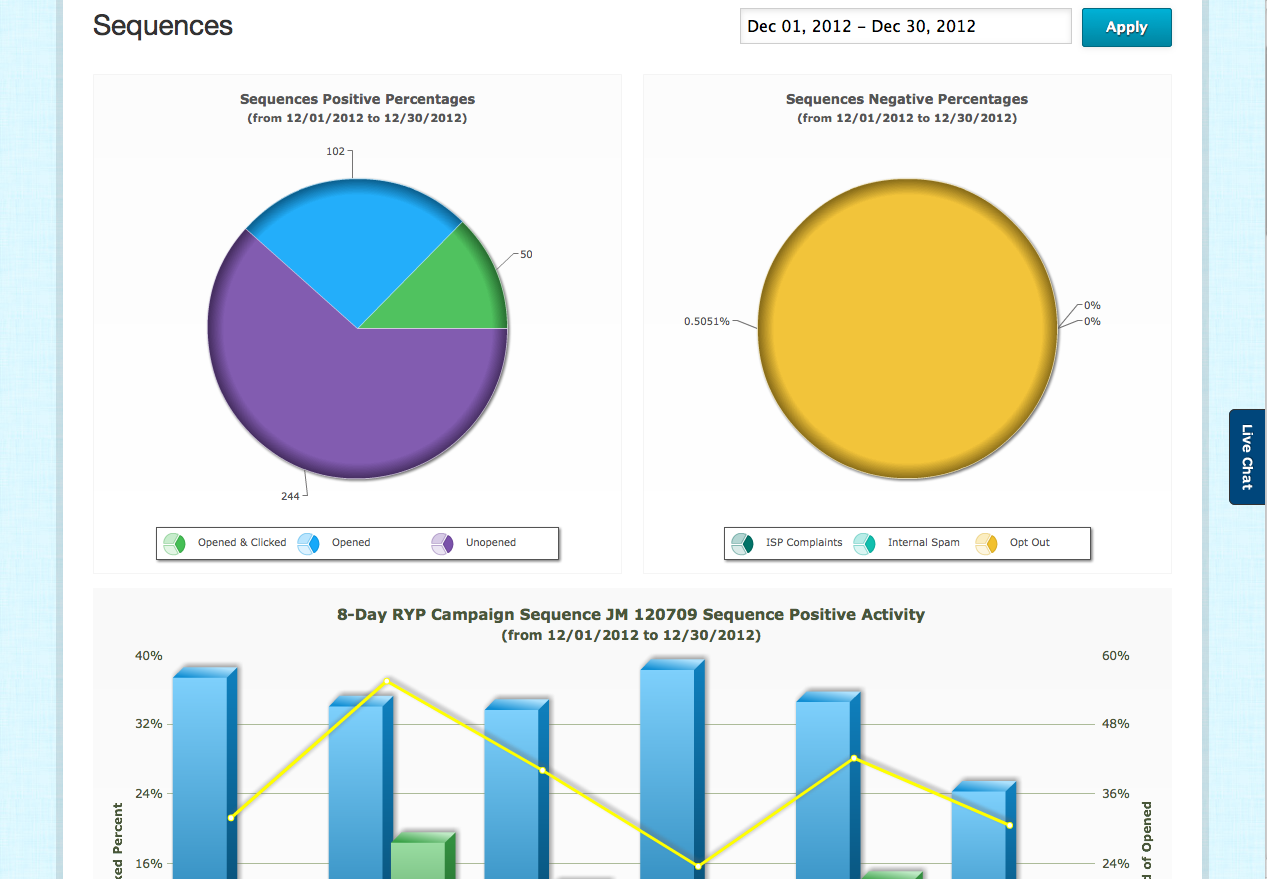
- Sequence Positive Percentages
- Sequence Negative Percentages
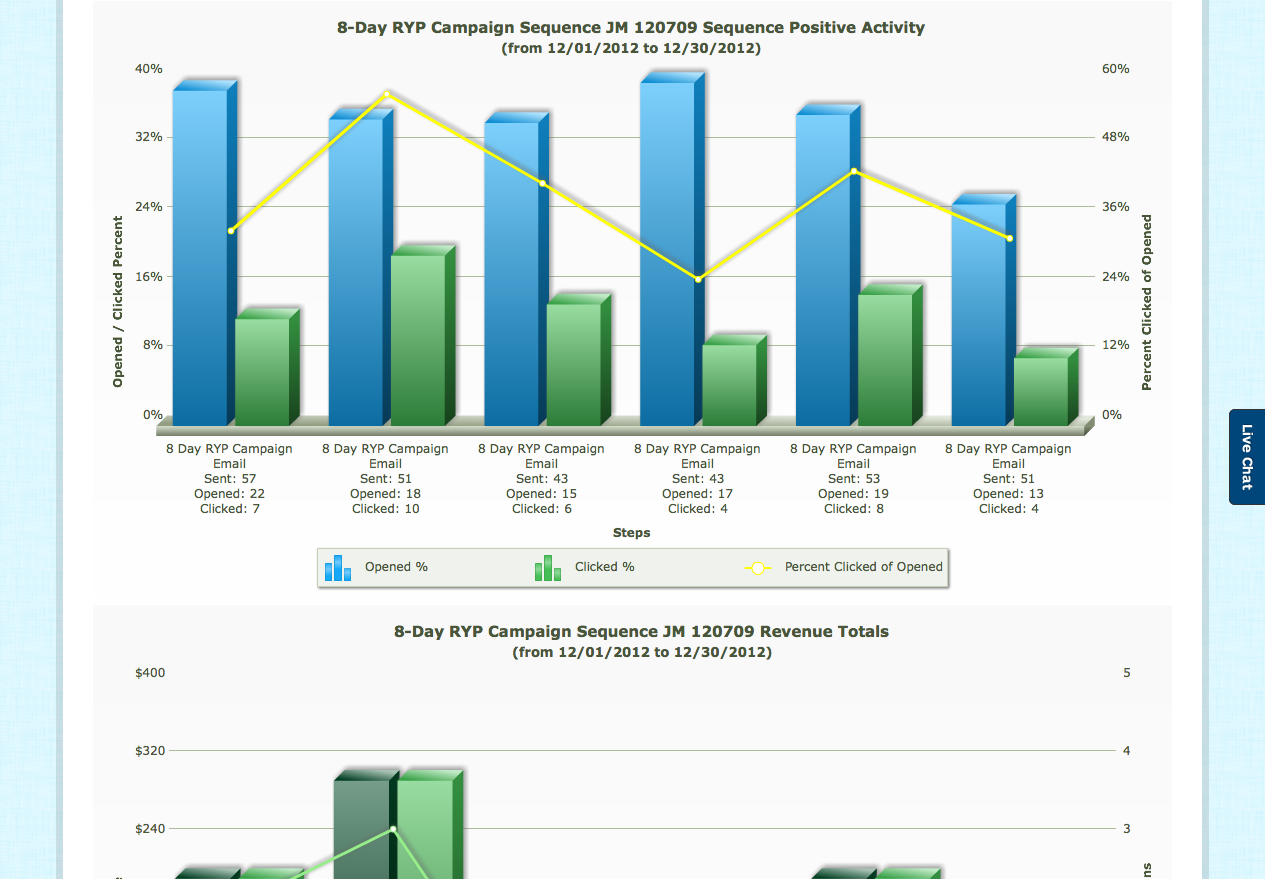
- Sequence Positive Activity
- Sequence Revenue Totals
- Sequence - Value Per Send
- Sequence - Value Per Opened
- Sequence - Negative Activity
- Email Status of New Leads
- Email Status of All Emails
- Last 12 Months Revenue
- Last 12 Months Outstanding Balance
- Last 12 Months Product Revenue
- Last 12 Months Product Transactions
- Daily Revenue
- Daily Product Revenue
- Daily Product Transactions
- Net Revenue Totals
- Expenses Totals
Coming Soon:
- Dynamic Tag Report to track funnel progression
- State to Stage movement (opportunities)


Log in or sign up for Devpost to join the conversation.