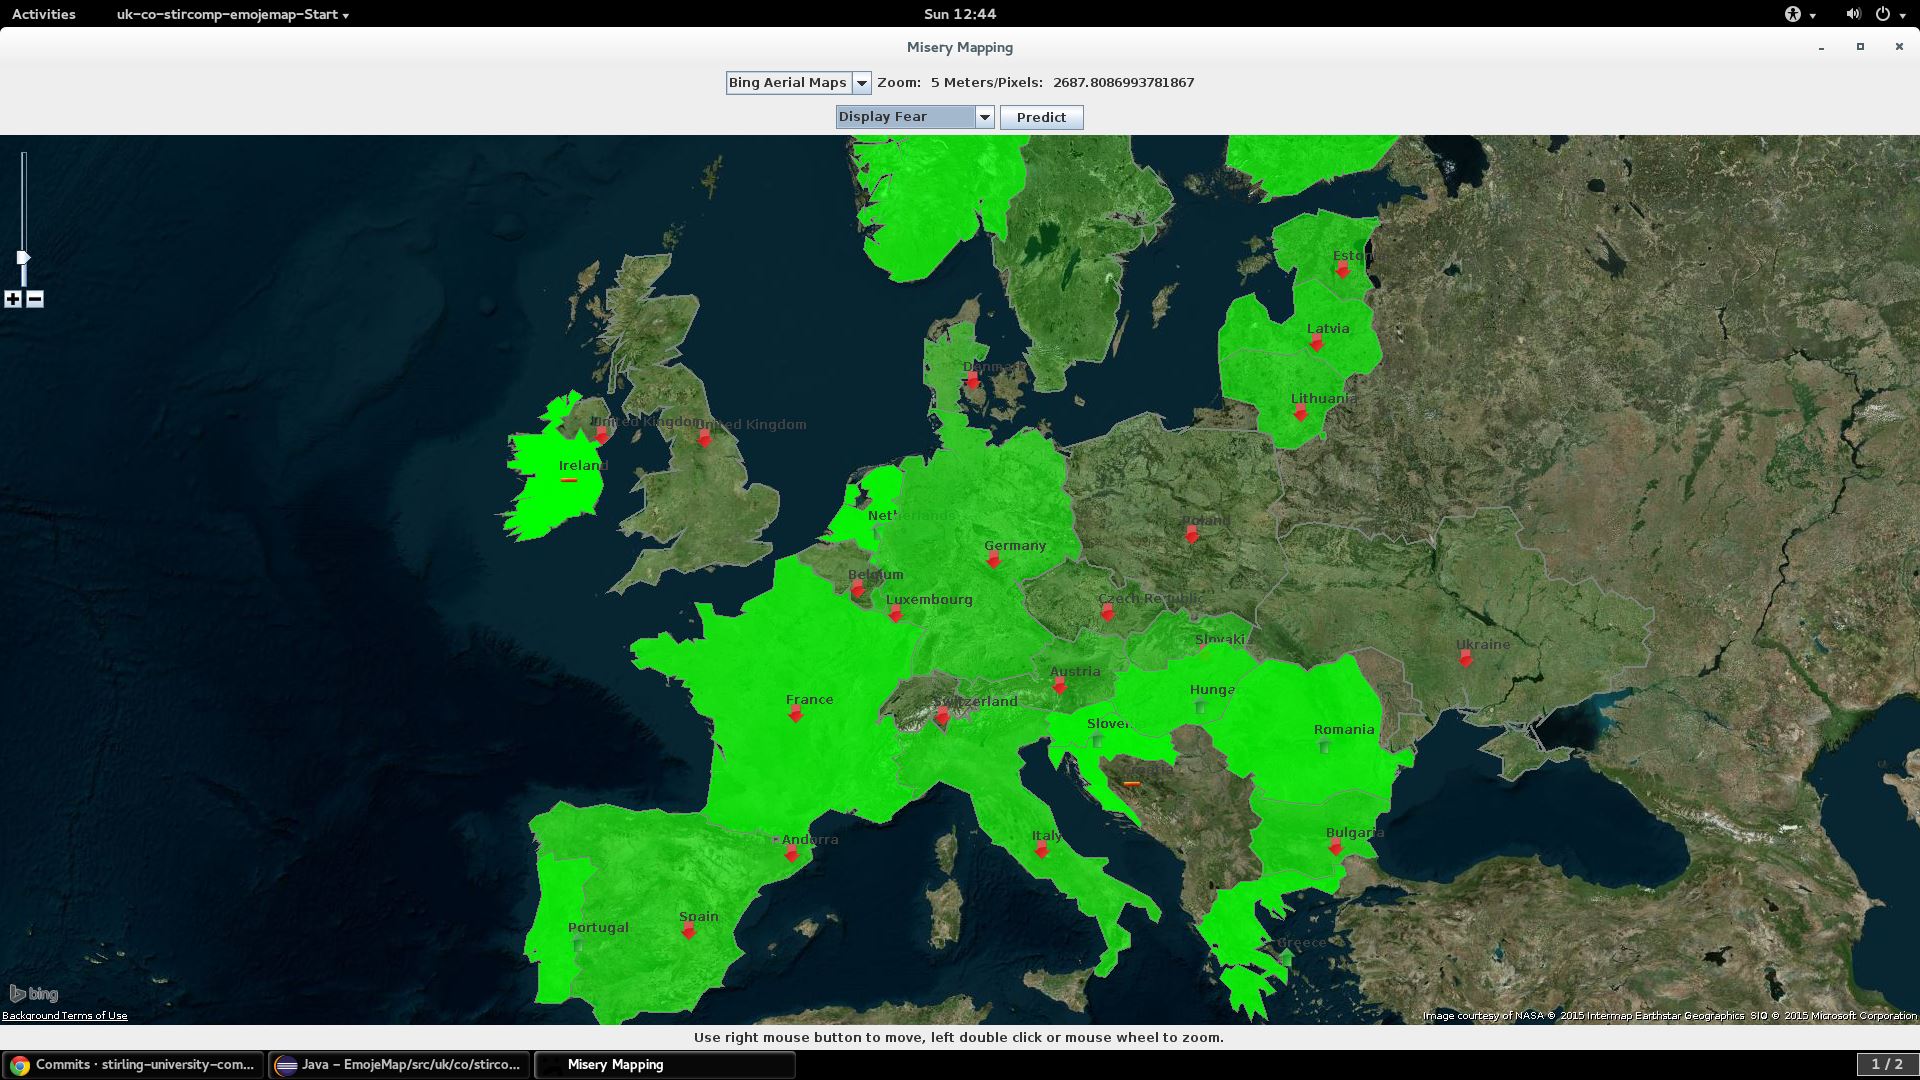
The map shows how happy, sad, or angry the population of a region is, based on social-economic factors and realtime analytics of social media. These factors include crime rates, price ratesm employment rates, and - basically things that affect people. The social media feed uses geolocation meta data to create a link between the words that people use, their emotions, and the region where they are.
This all happens in real time. The system shows the level of emotion by the transparency of the overlay on the map, with borders showing the most recent change (turning black for an increase in the emotion, white for a decrease and grey for no change since the last update). The system also attempts to predict where the trend for the country is heading, suggesting whether it will increase in that emotion, decrease, or stay the same.
This product could be used by media organisations or advertising agencies to target programs/articles/advertisments of a certain sentiment to reflect or counter the public feeling.
Built With
- bloomberg
- google-mapping-co-ordinates
- java
- jmapviewer
- openstreetmap


Log in or sign up for Devpost to join the conversation.