Inspiration
Everyone who lives in an urban environment deserves convenient access to businesses that serve their basic needs. In 1995, urban planners and public health researchers began studying the problem of food deserts in cities, areas where residents lack a grocery store within one mile of their homes.
Access to food is clearly a basic need, a need filled by grocery stores. What other types of business fill other basic needs in people’s lives? The Oasis team wanted to see if it would be possible to analyze the City of Chicago’s database of business licenses to study other essential needs and the business types that fill them and to identify any deserts that exist for those businesses.
How Oasis works
Data Analysis and Preparation
The analysis begins with a dataset from the City of Chicago’s data portal. It documents every business license issued since 2006 (with some licenses going as far back as 1996) and includes the business’s name, address, longitude, latitude, and business license type.
We also downloaded from the U.S. Census Bureau's website data identifying all of the 1,320 census tracts within the city along with the 2010 population counts and coordinates of each tract’s centroid (center point). This data was enriched with a mapping to the city’s officially recognized 77 community areas / neighborhoods.
We uploaded the data to IBM’s Bluemix cloud-based service and ran scripts written in Apache’s Pig Latin language to produce Map/Reduce jobs that computed accessibility factors for each census tract and community area for every business license type.
We also used this analysis to identify critical businesses. A critical business is the only business of its type serving a given population. If a critical business closes, thousands of people are left in a desert.
We ran the calculations and prepared the data using Pentaho Data Integration (an Opensouce ETL tool). This data is made available to a the web application written in node.js and is hosted on Bluemix.
Visualization and Presentation
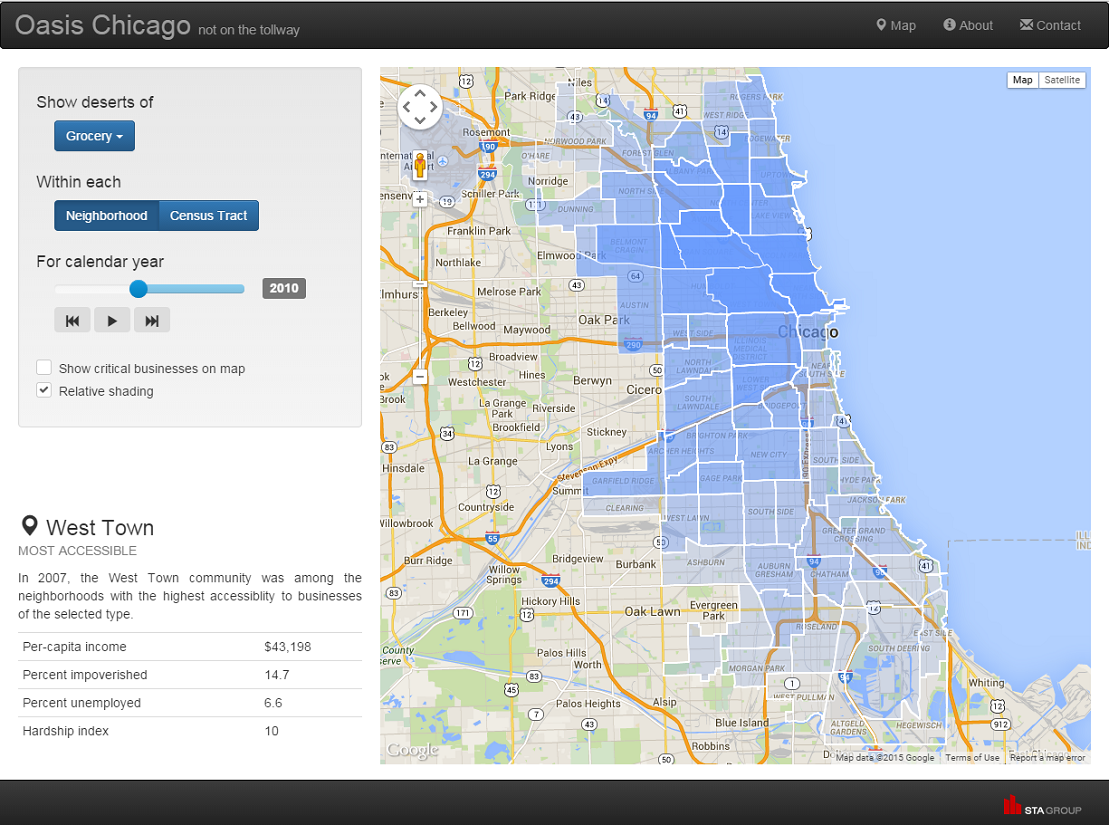
The visualization front-end is a Node.js and Express application making heavy use of Twitter Bootstrap and Google Maps in the browser. It allows users to explore the business accessibility data that we processed in the Bluemix environment. The application displays a map of Chicago with each neighborhood or census tract outlined and shaded to indicate that area’s accessibility to businesses of the selected type relative to other areas in the city. Hovering over an outlined neighborhood displays socioeconomic data for the community (rates of poverty, unemployment and hardship), enabling users to detect correlation between business accessibility and other factors.
Checking “Show critical businesses on map” displays a marker on the map highlighting the location of each business that, if it were to close, would place a large population into a desert. Clicking a marker renders a street view of the corresponding business along with details of the size of the population at risk.
Checking “Relative shading” adjusts the coloring of each area so that it represents a level of accessibility relative to only those other areas presently visible on the map. This feature enables users to see fine-grained differences between neighborhoods that, relative to the city at large, do not substantially differ in their levels of accessibility.
When viewing the data in terms of census tracts, clicking on the map renders three concentric circles representing a distance of one mile, two miles and three miles from the selected point. Hovering over these circles shows how many businesses of the selected type exist within the encircled area.
Frequently Asked Questions
Why I do I sometimes see two or more critical businesses near one another? This would seem to violate the concept, wouldn’t it?
It may seem to violate the concept, but in fact it doesn’t. Imagine two businesses separated by a block, east and west of one another. Since we define a critical business to be one that serves a large population within one mile of its location, it’s possible that closing the east business would put the corresponding eastern population at a distance of more than a mile from the western business--even if by only one block.
When relative shading is enabled, I notice the areas near the boundaries of the map sometimes lose their shading altogether. Is this a bug?
Sort of. When relative shading is enabled, only those areas visible on the map are shaded (the rest are unshaded). “Visible” in this context means that the center (centroid) of the area is visible on the map. If the center of the area is not within the map’s viewable boundaries, then the entire area--including the portion which is visible--loses shading.
How are the levels of desertification determined? How does an area colored light blue differ from one colored dark blue?
The shades represent the relative accessibility of a given business type compared to accessibility in other areas of the city. This formula sometimes produces what might be considered misleading conclusions. Take, for example, hotels in the city: because we find such a large percentage of all the city’s hotels in the downtown area, outlying neighborhoods appear universally as deserts, even though a more nuanced consideration of what constitutes a “hotel desert” might reach a different conclusion.
Some census tracts are shaded gray. What does this mean?
It means that we don’t have data for the area and cannot make a determination of its level of desertification.
Why is the range of selectable years inconsistent across business types?
This is a limitation of our source data. For a variety of reasons, the City of Chicago does not publish business license data across a consistent range of years.
What made you choose the selection of business types? I’d rather be able to see deserts of [insert-your-favorite-business].
We agree, but our data is based on business license categories issued by the City of Chicago. Each selection in the menu represents a different type of business license, which may or may not always be interesting to an application like ours.
One exception: The city produced a special dataset for grocery stores (even though grocery stores are licensed within a more broad license category--”retail food”).
When I click a critical business marker, why isn’t the street view always oriented towards the corresponding business?
This is, in our humble opinion, a “limitation” in Google’s internal street view logic. There are some available workarounds, but they were deemed too complicated for this effort. Our apologies.
Why does the street view sometimes show an address/area that doesn’t appear to have anything to do with the business in question?
The markers (and street views) are based on the latitude and longitude associated with the license. In some cases the business license may be addressed to an owner’s residence or a holding company, even if the product or service is being offered elsewhere. (Think of food trucks, peddlers, and similarly mobile businesses...)
Challenges we ran into
We discovered that the business license types reported by the city’s database are a mixed bag of very specific categories (Motor Vehicle Repair - Motor Only) and very broad categories (Regulated Business License). We were disappointed to find that Grocery Stores were lumped together with restaurants and other businesses under Retail Food.
Fortunately, the city had recently produced a one-off extract of Grocery Store licenses for their own food desert analysis and made that dataset available via the data portal. We were able to cross-reference the business license IDs from that extract with the main business license database to identify grocery stores.
We have been in discussion with the City’s Chief Data Officer to create some new extracts for other specific and essential business types. For example:
- Pharmacies
- Hardware stores
- Dry cleaners
- Doctor’s offices
Our data loading pipeline is now sufficiently extensible that we can include these enrichments as they become available.
Accomplishments that we're proud of
We used technologies with which some team members were only minimally familiar. We also put it into the Bluemix environment, which we had not used before. We were limited in the amount of time we could allocate to the project, since we also had our normal workload. We are pleased that this could come together without any major hurdles.
Insights Gained
We feel that the identification of “Critical Businesses” is a powerful outcome from this analysis. It would be very difficult to detect anything special about these businesses from the ground level, however analyzing the businesses and populations in the city using Big Data techniques allowed us to uncover these vital resources. We hope that we will be able to use this information to support the businesses and protect neighborhoods’ access.
What's next for Oasis
We are working with the City to get more detailed business licenses types, with a particular emphasis on businesses that are critical to citizens’ life and fulfillment.
We are looking to bring in organizations that promote social enterprise to explore potentials to use our data to identify and impact critical businesses located throughout the city.
We will be presenting this application and its data to Chicago’s Open Government Hack night to see if we can find additional uses for the application and to open up the code to other interested parties.
Data Sources
Business License Data from the City of Chicago Data Portal
https://data.cityofchicago.org/Community-Economic-Development/Business-Licenses/r5kz-chrr
Grocery Store Extract from the City of Chicago Data Portal
https://data.cityofchicago.org/Community-Economic-Development/Grocery-Stores-2013/53t8-wyrc
Census Tracts For Illinois
https://www.census.gov/geo/maps-data/data/docs/gazetteer/census_tracts_list_17.txt
City of Chicago Neighborhood (Community Area) Boundaries
Mapping Between Census Tracts and Chicago Community Areas
http://robparal.blogspot.com/2012/04/census-tracts-in-chicago-community.html


Log in or sign up for Devpost to join the conversation.