Splunk App for Microsoft System Center Configuration Manager (SCCM)
System Center Configuration Manager (officially called ConfigMgr 2012 or ConfigMgr 2007 or simply ConfigMgr), formerly Systems Management Server (SMS), is a systems management software product by Microsoft for managing large groups of computers running Windows, Windows Embedded, Mac OS X, Linux or UNIX, as well as various mobile operating systems such as Windows Phone, Symbian, iOS and Android. Configuration Manager provides remote control, patch management, software distribution, operating system deployment, network access protection and hardware and software inventory.
- Wikipedia: System Center Configuration Manager
The Splunk App for SCCM provides Windows System Administrators with an efficient overhead view of their Windows Desktop and Server environments, allowing them to easily detect new systems under management and spot outliers that may indicate a misconfiguration or a potential security risk.
The Splunk App for SCCM includes overview dashboards for:
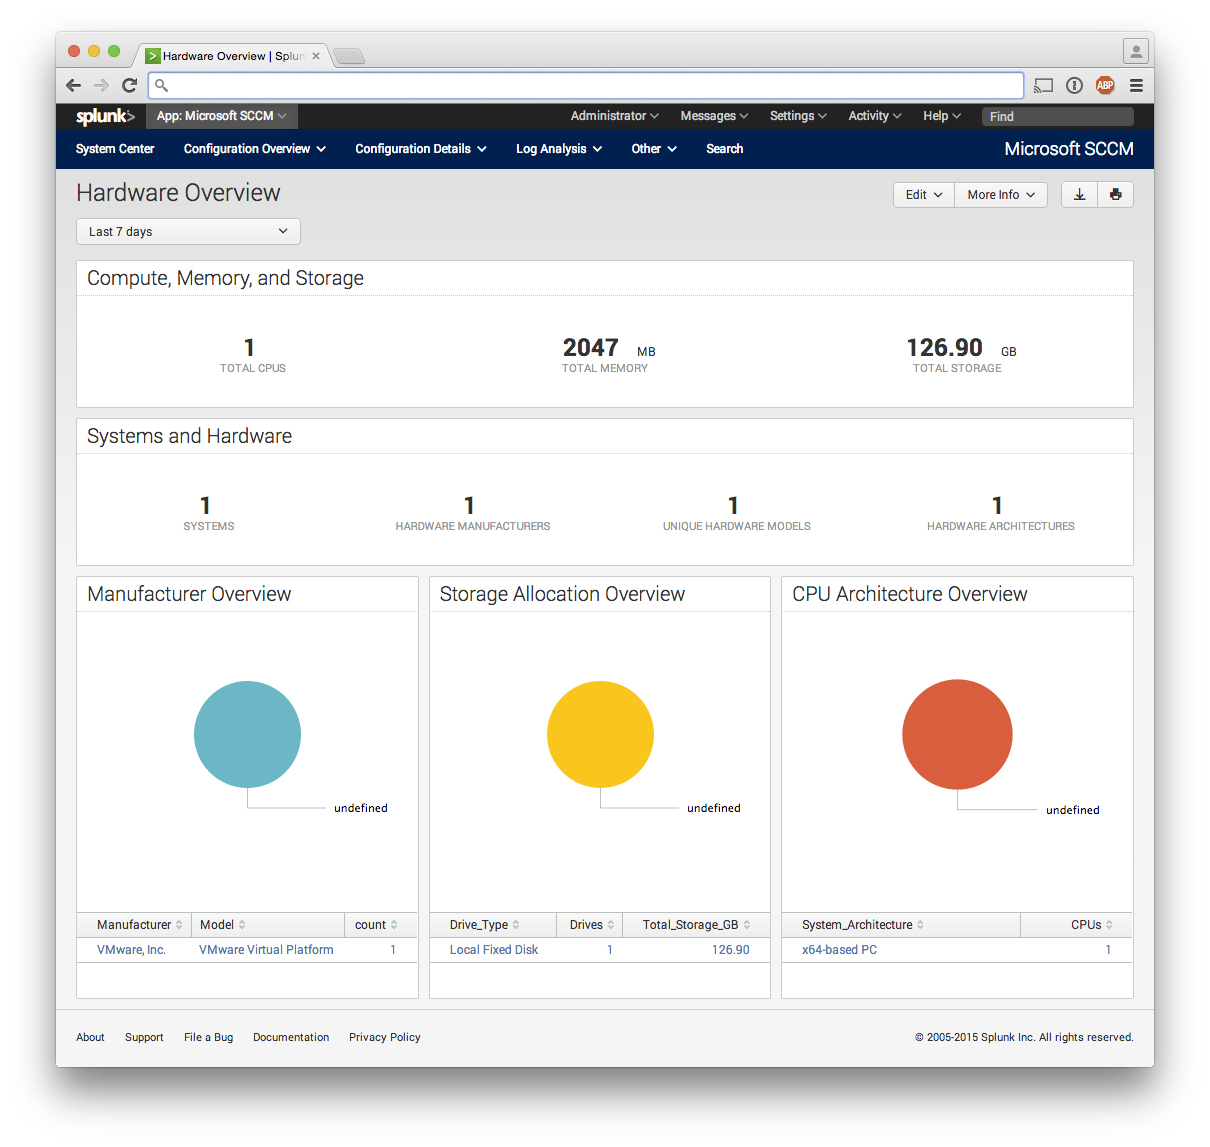
- Hardware - Total CPUs, Architectures, Memory, Disks.
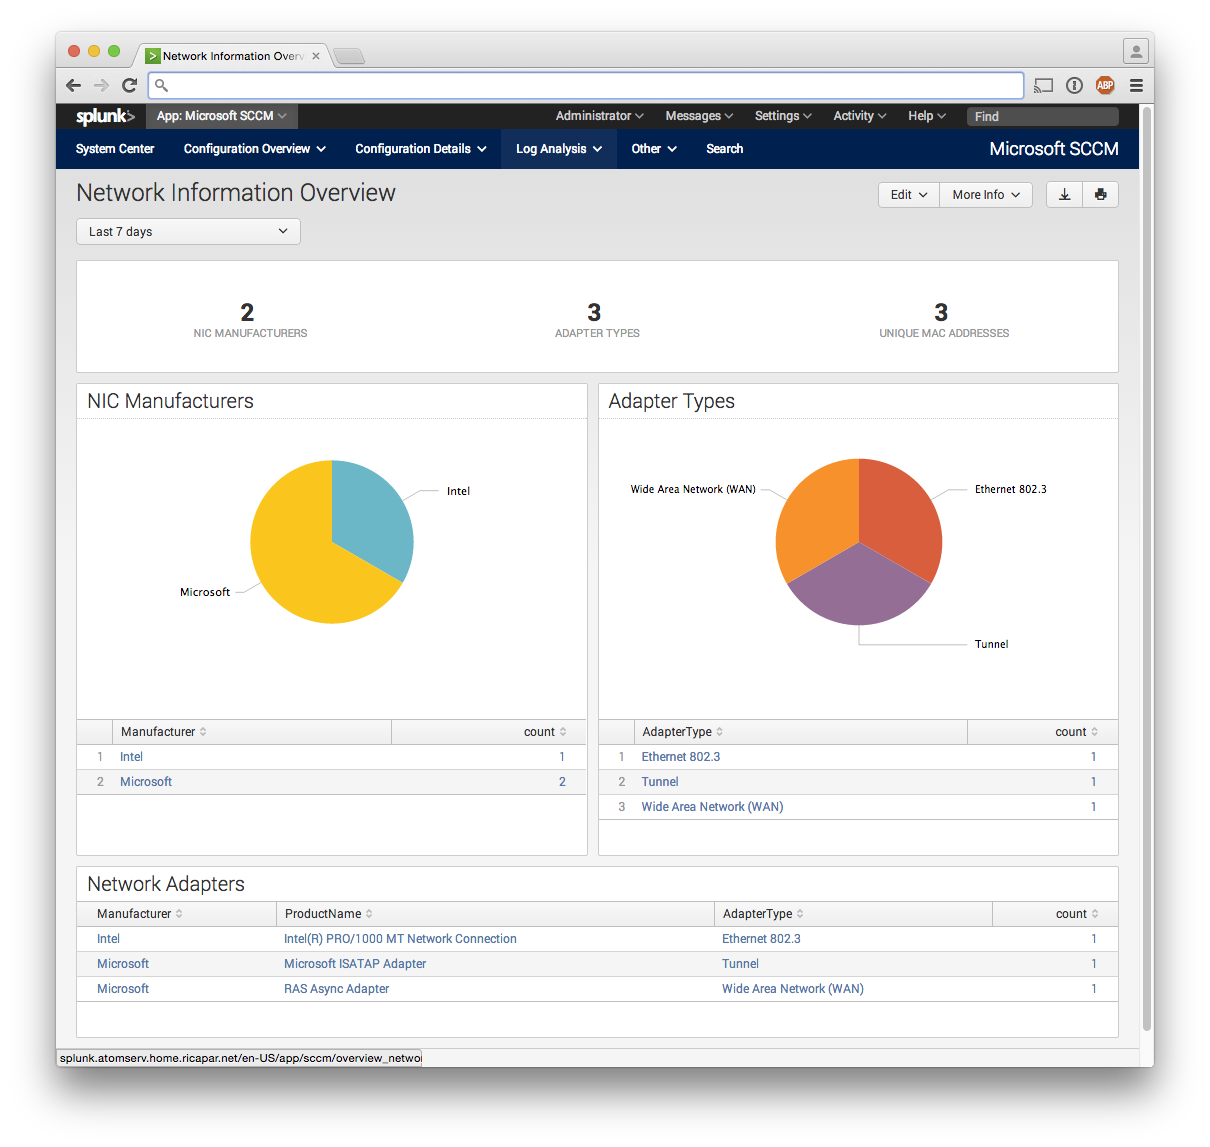
- Network - Number of unique MAC Addresses, NIC types and vendors.
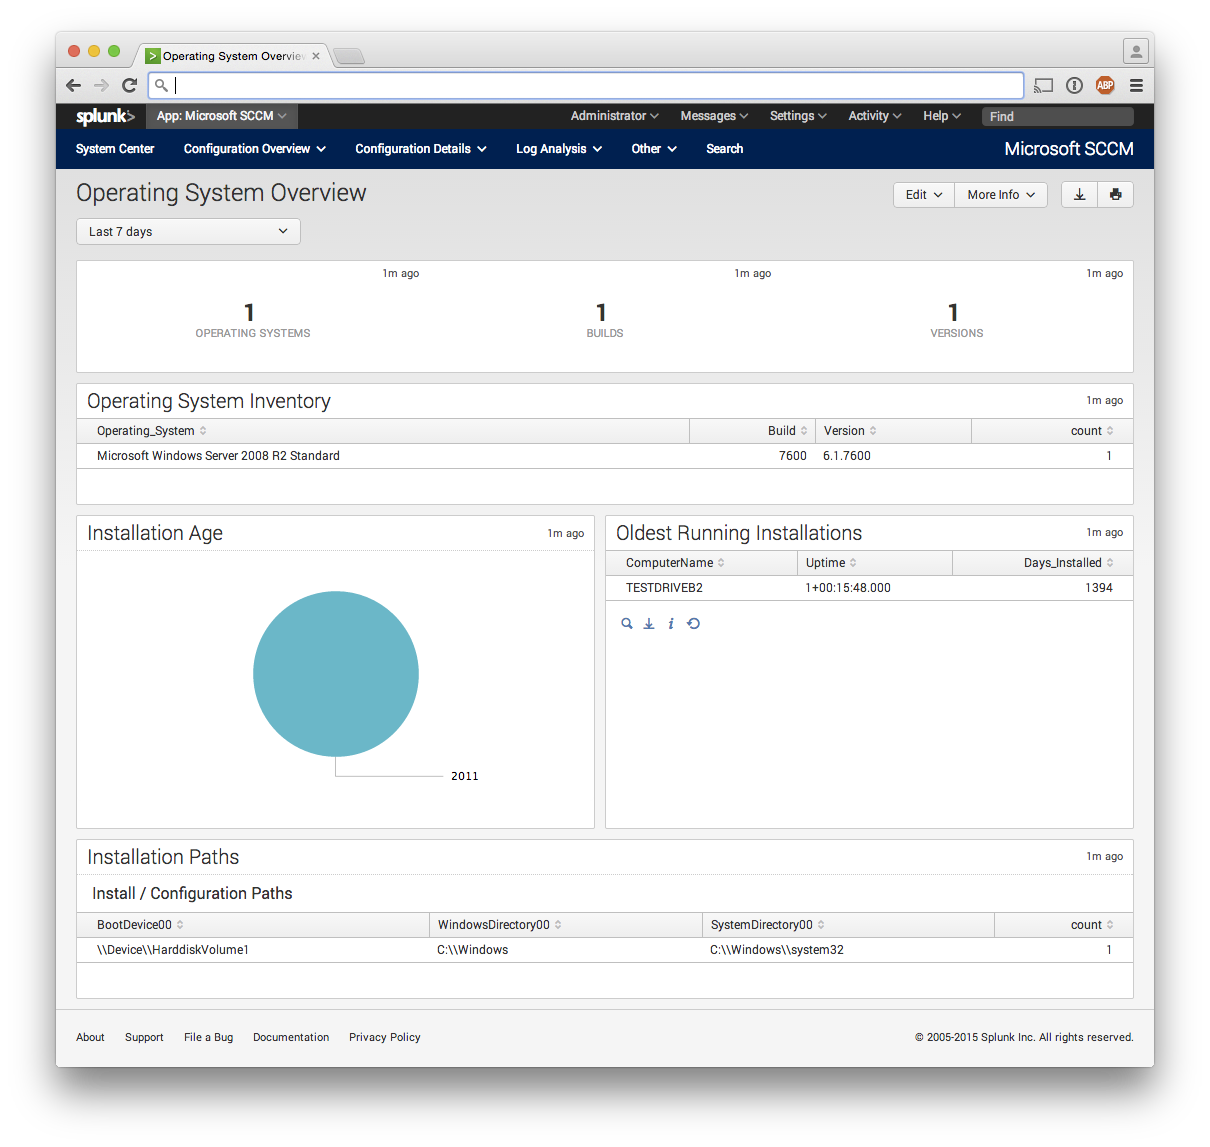
- Operating System - Number of unique OS versions, builds, releases, and installation dates.
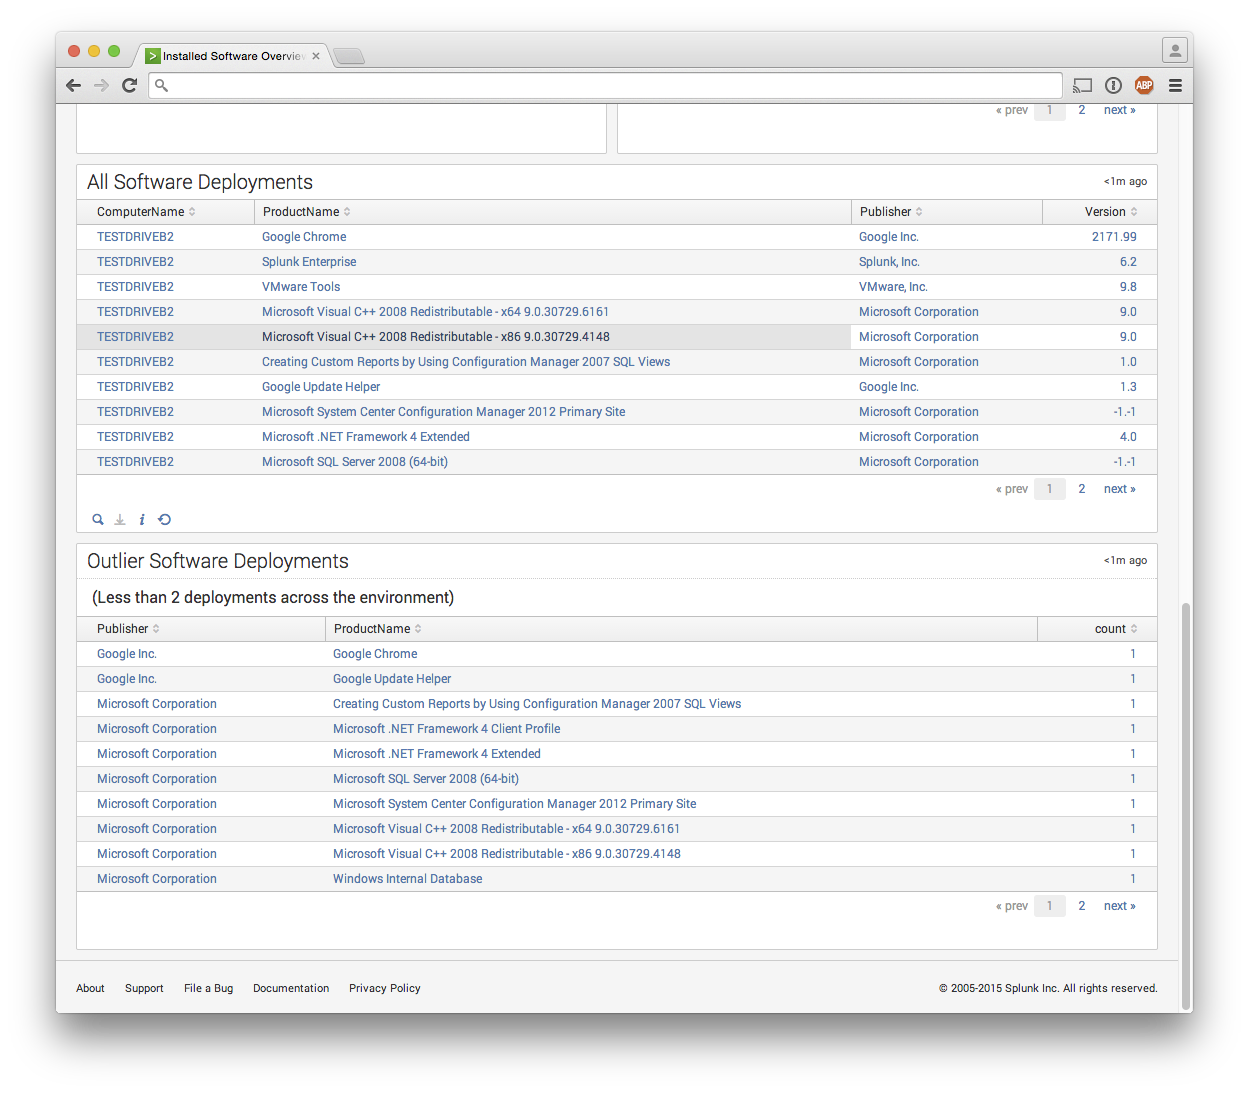
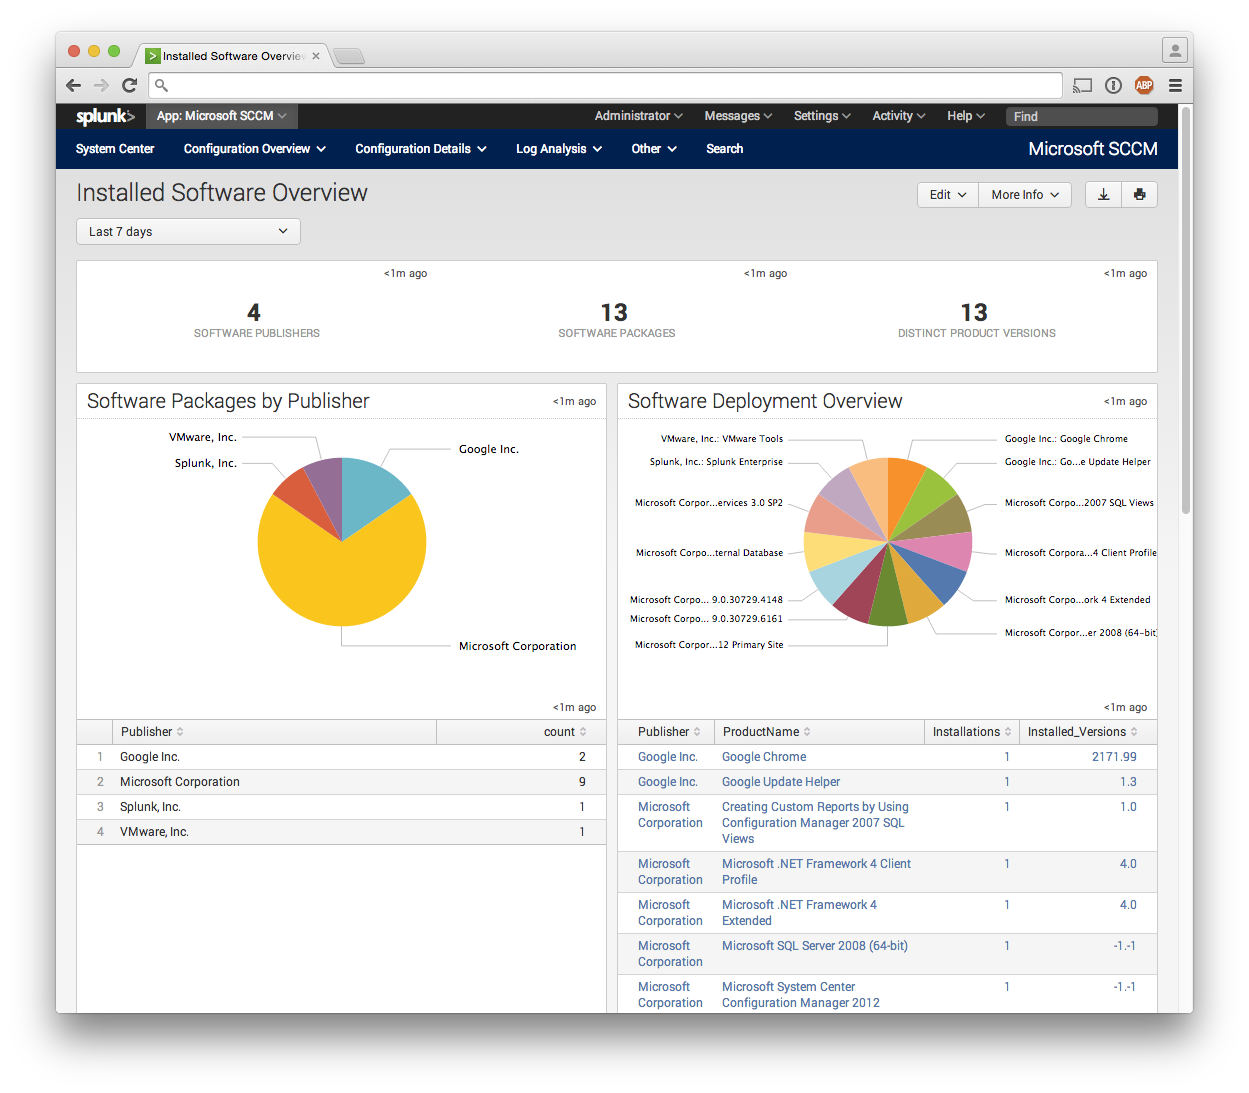
- Software - Number of software vendors, number of packages provided by each vendor, and product versions.
More detailed dashboards are also provided for each of the above categories, allowing an administrator to see information specific to a particular server within the app.
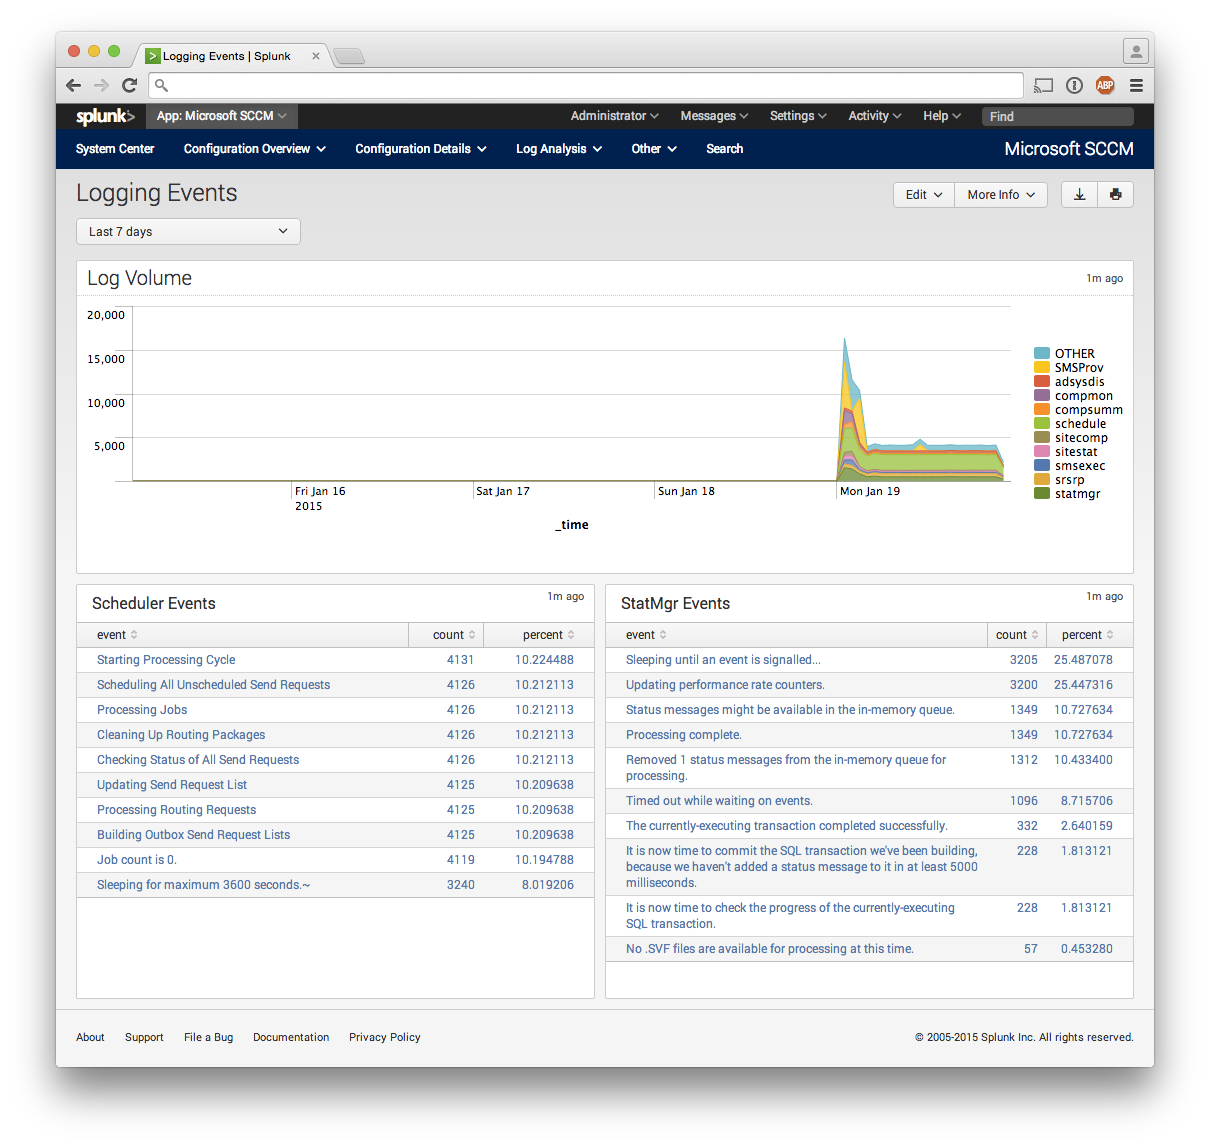
Dashboards for monitoring SCCM's internal logs provide an additional insight into the health and performance of SCCM and its related components.
Example Use Cases
- Using the Oldest Running Installation view under the Operating System Overview dashboard, administrators can identify old systems that may be in need of a refresh.
- Administrators can get an overhead view of how many different software vendors they install products from, allowing for accurate license cost prediction.
- Automatic detection of installed packages allows for auditing and detection of unauthorized software installations across the environment.
- The Hardware Overview dashboard can be used to communicate the size and scale of an enterprise's Windows Server footprint in terms of CPU, Memory, and Disk Space.
- The Service Investigator can be used to identify Services running on specific servers or auditing RunAs users for services (ex: company policy says non-Microsoft services cannot run as LocalSystem).
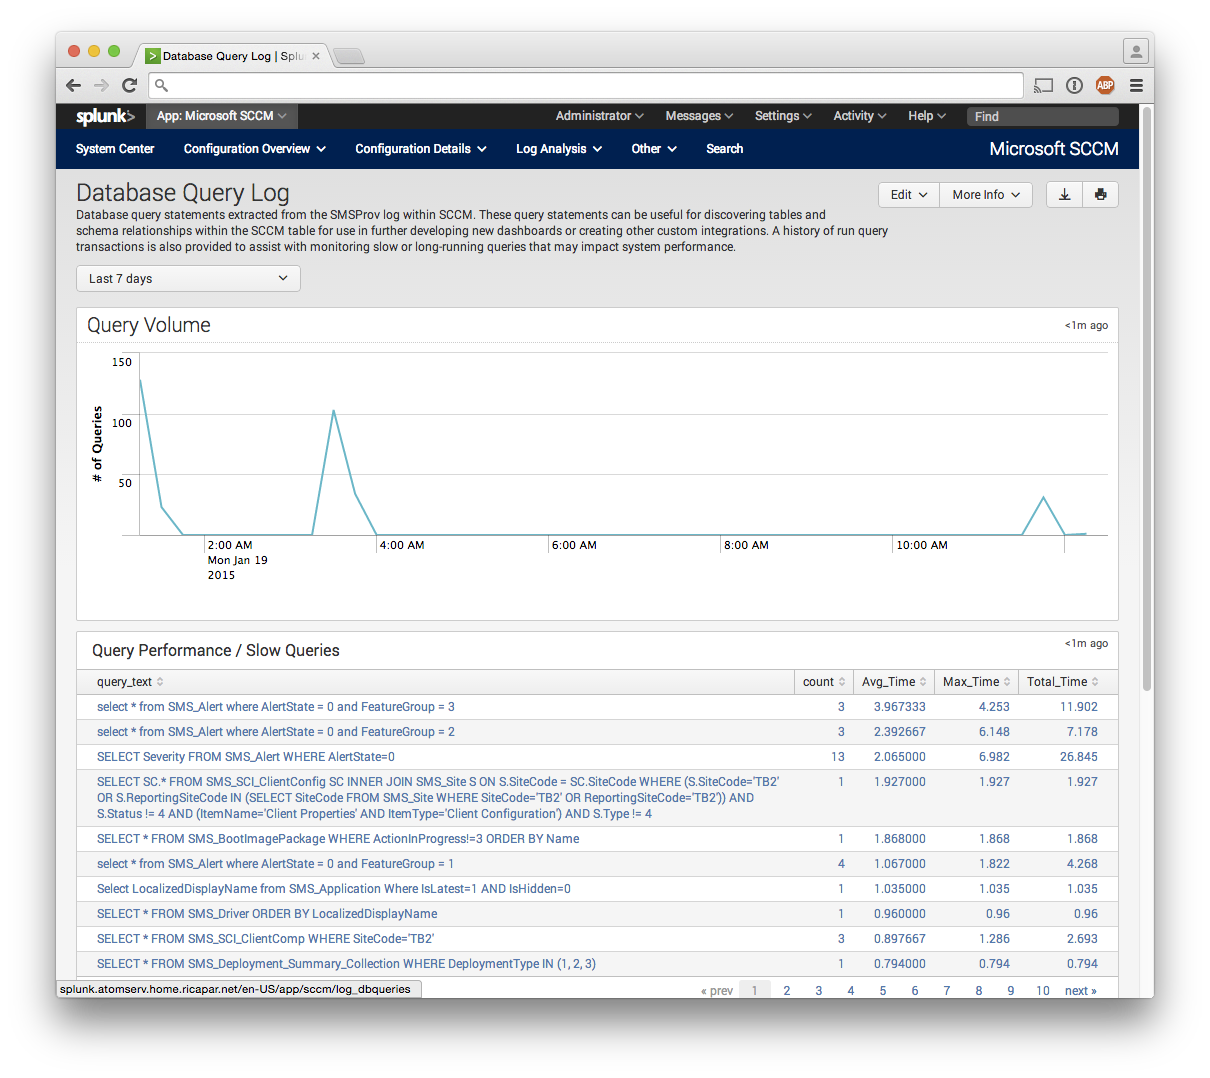
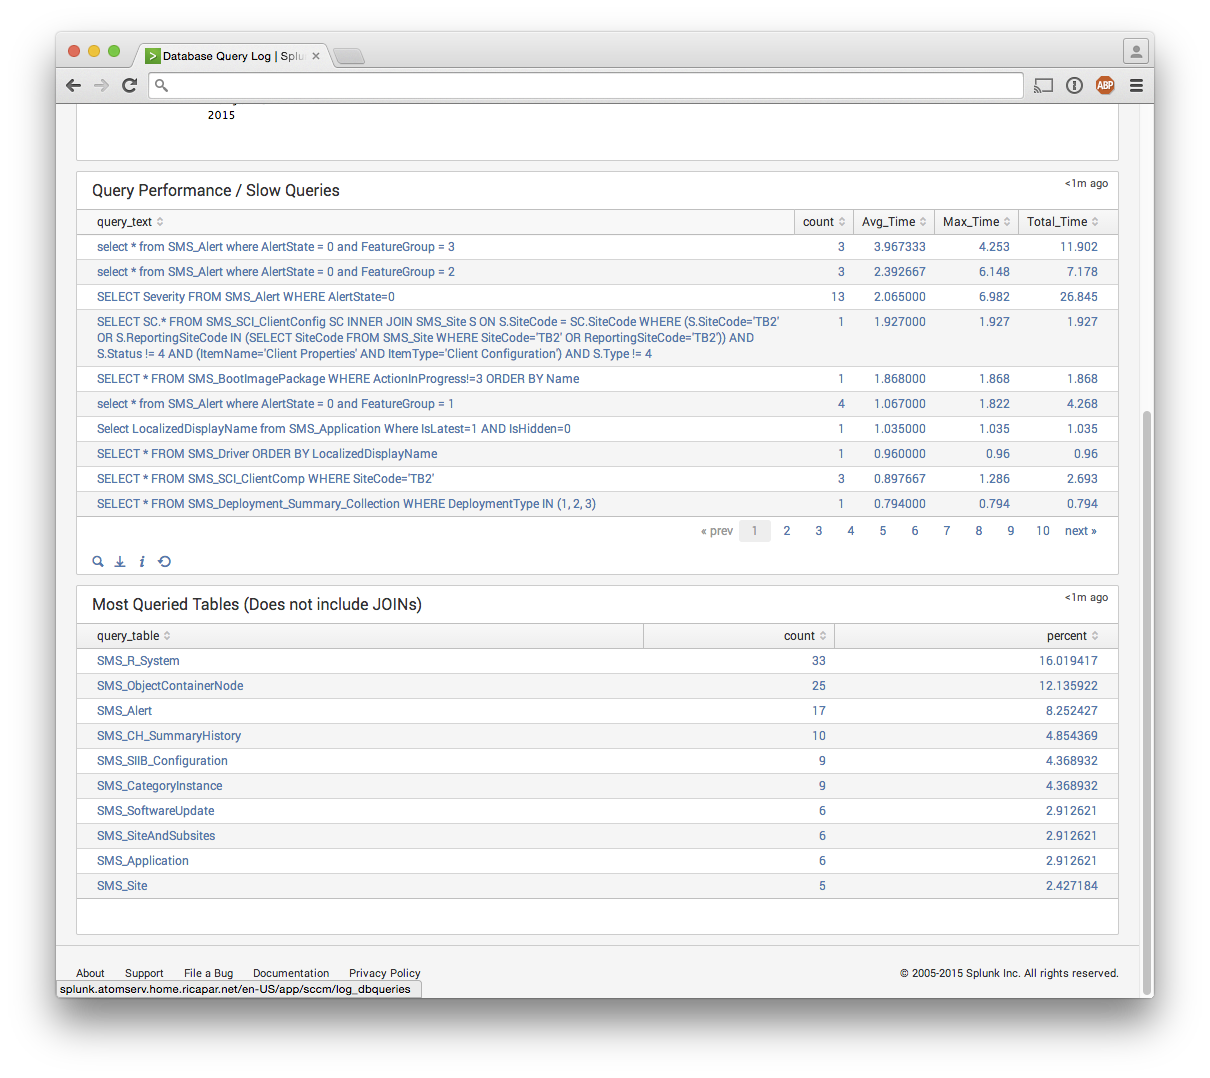
- Using the Database Query Log, an administrator can identify problematic, repated, or slow queries being run against the SCCM database. The same log is also useful for helping an administrator discover relationships between tables and views within the SCCM database, which is often lacking in documentation. For more information on this use case, see the Database Query Log section below.
The Database Query Log
SCCM uses an instance of Microsoft SQL Server to store the core of its configuration details. Since an administrator is able to delegate or give access to the SQL Server DB, a large amount of external reporting capabilities are opended up. However, navigating the schema and fully understanding all of the relationships between tables can often be difficult.
Various people have had success using SCCM's SMSProv log to better understand what tables SCCM queries and accesses directly when performing specific tasks, in hopes of being able to "sniff" out the executed query and use it as a starting point for an external report.
In setups where SCCM provides a mission-critical role, placing too much load on the database could result in poor system performance. For this purpose, the dashboard includes a "transaction" view of all queries run against the database. Info about the queries includes:
- Table
- Number of times the query was run (count)
- Average run time for the query (Avg_Time)
- Maximum run time for the query (Max_Time)
- Total Time spent running the query over the total number of runs (Total_Time, expressed as the calculation of: duration * count)
Requirements
Splunk Requirements
- Splunk 6 or greater (tested on 6.2.1)
- Splunk App: DB Connect
- An domain or local account with read permissions on the SCCM MS SQL Server database.
- An index titled
sccm(provided byinputs.conf, packaged in the app) - Ability to receive events from a Windows server running SCCM
SCCM Requirements
- An SCCM environment
- Splunk Universal Forwarder running on the same machine as SCCM, or a way to collect logs from SCCM's installation directory
- Knowledge of SCCM's installation directory (usually located at:
C:\Program Files\Microsoft Configuration Manager\).
Initial Configuration
Steps below were originally provided by the Splunk-provided base application:
- Install pre-requisities
- Splunk Enterprise
- DBConnect App
- Login to Splunk
- Click on Settings->Access Controls->Users
- Grant your logged in use the DBX Role to your account
- Unzip/Untar the file in the the /opt/splunk/etc/apps directory, or the C:\Program Files\Splunk\etc\apps directory if you’re on Windows.
- In the sccm directory it creates, you will find a inputs.conf file in the root of the directory. DBConnect does not recognize dmon-tail inputs from the app, so you will need to add the stanzas to your inputs.conf located in /opt/splunk/etc/apps/dbx/local or C:\Program Files\Splunk\etc\apps\dbx\local directory.
- After adding, log back into Splunk and you will now notice an SCCM App. Click on the SCCM App.
- Click on the Reports Tab
- Click on Lookup Generator – Step1
- Click on Lookup Generator – Step2
- Click on Lookup Generator – Step 3
- Within 15 minutes, you should start to see data populate each of the dashboards.
Additional steps for log analysis and monitoring:
- Install the Splunk Universal Forwarder on a machine running SCCM.
- Configure the forwarder to send events to your indexer(s).
- Create an
inputs.confentry with the stanza noted in the section below.
[monitor://C:\Program Files\Microsoft Configuration Manager\Logs\*.log]
sourcetype = sccm_log_raw
index = sccm
Enhancements
The sample application proposed various enhancement ideas that were taken into consideration while developing this release.
Those enhancements included, but weren't limited to:
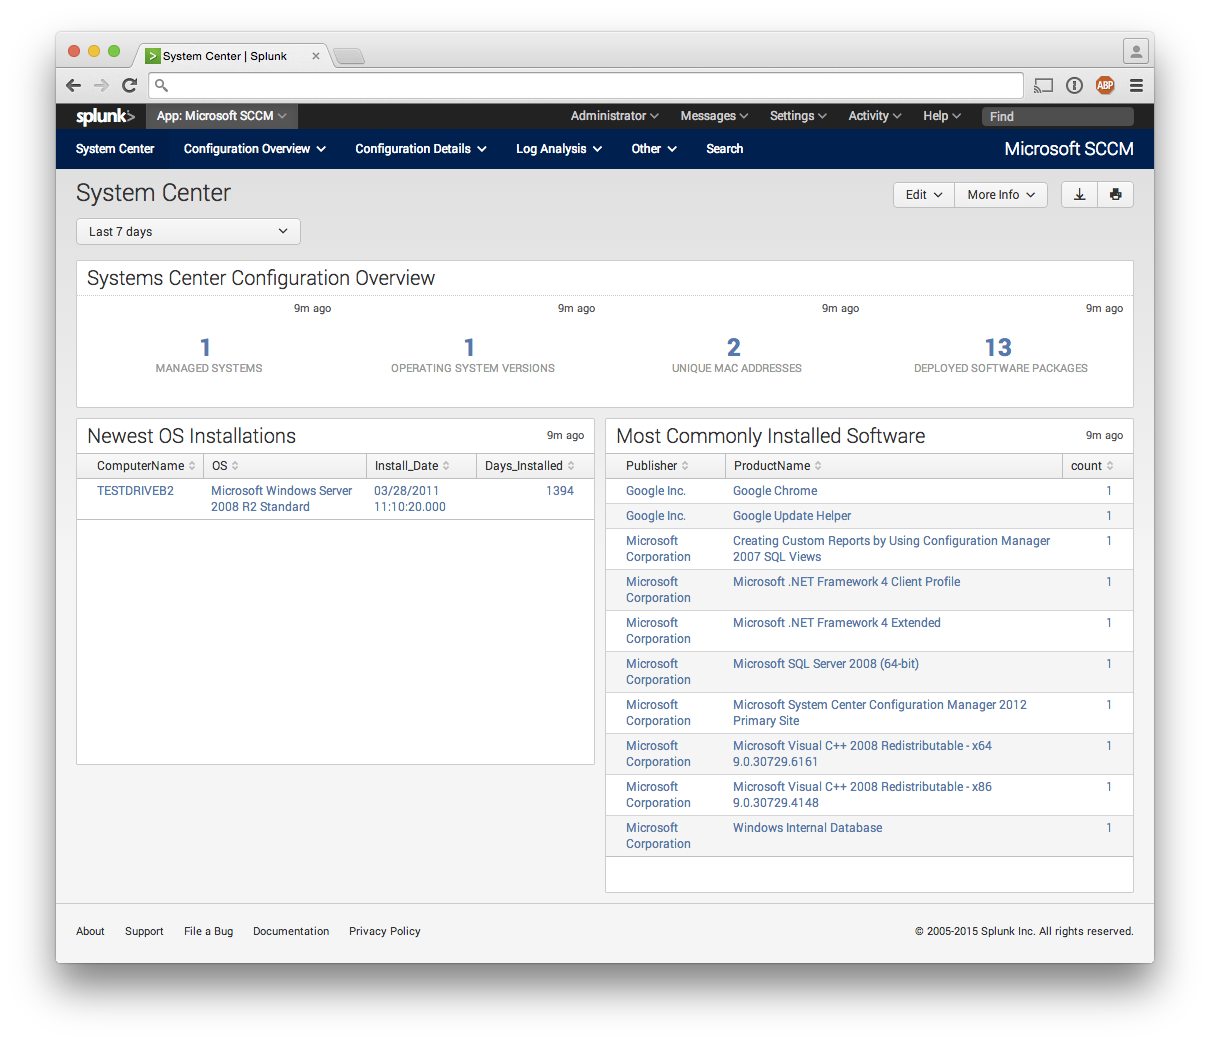
- The default entry page on any app should be a good overview of the important points of the app. We felt the existing page was lacking content, and rewrote it to include a quick summary of an important datapoint from each area within the application. These datapoints act as drilldowns into their corresponding dashboards.
- In addition to a rewritten homepage the navigation tabs were rearranged and relabeled, providing more direct access to specific dashboards.
- A new tab, Log Analysis, has been added into the navigational menu. The Log Analysis tab contains dashboards for logs collected from SCCM's local log directory.
- Brand-new "Overview" dashboards were created, providing 36 post-process-optimized dashboard panels to give a quick overview of different metric areas within SCCM.
- Many of the pre-existing dashboards were taking a lengthy time to load, due to lack of post-processing - which we added - but also because they were searching data from 'All Time'. To any pre-existing dashboards that remained within the application, and to all newly created dashboards, we added a Time Range Picker with a default of 7 days. Since SCCM updates once per day, 7 days should give a good initial range of data, and the range can be modified by the user for a more historical search when needed.
- The applicable investigator tabs were modified to include dropdowns containing the ComputerName, instead of a single text box. Since these dashboard panels should only be displaying data for one computer at a time, this seemed appropriate.
- Searches have all been modified to consistently rely on indexed data. Where applicable, an Automatic Lookup
is used to further enrich fields within events. Lookups are no longer used "on the fly" via
inputlookupcommands. - Searches have either been rewritten to
dedupon the proper combination of fields, or rewritten using the appropriatestatscommands to ensure each record is accounted for at its correct point in time. - Some of the titles of the panels did not adequately represent their content, and some of them were not doing what they seemed to be - eg. an existing Time Range Picker was not being utilized, a field called Domain was being called in a lookup table when this field did not exist, the Process Investigator tab was Software based and didn't line up with the Overview tabs. Several of these inconsistencies were identified and remedied.
- Application components have been properly packaged, as per the Splunk recommendations. No
local.metafile is included, and all resources reside under thedefault/app directory.
Closing Notes
This application was created by Rich Acosta and Erica Feldman as an entry
for the Splunk Apptitude contest. A sample application, sccm.spl was provided
to contestants as part of the contest resources.
This application began as an improvement on top of the provided sample application, improving on data integrity, correctness, performance, aesthetics, and grammar throughout the application.
As the application was developed, many components of the original sample app were rewritten or completely replaced.
License Information
Where applicable, the modifications to this app by Rich Acosta and
Erica Feldman are licensed under the MIT License. See LICENSE for full details.
Built With
- sccm-2012
- splunk
- windows-server-2008-r2


Log in or sign up for Devpost to join the conversation.