Inspiration
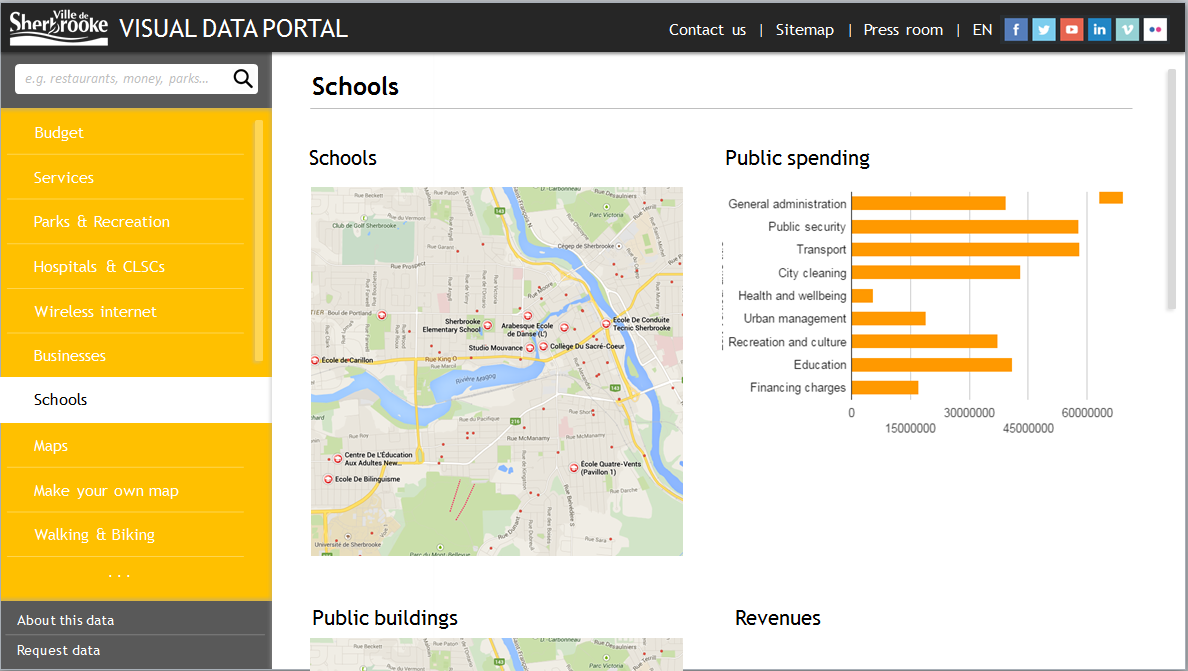
Just because data is open and available doesn't mean it's actually accessible. Our mission is to make data about all the services Sherbrooke provides accessible and fun to explore, so that the average citizen can get involved and better understand how the city works for them!
How it works
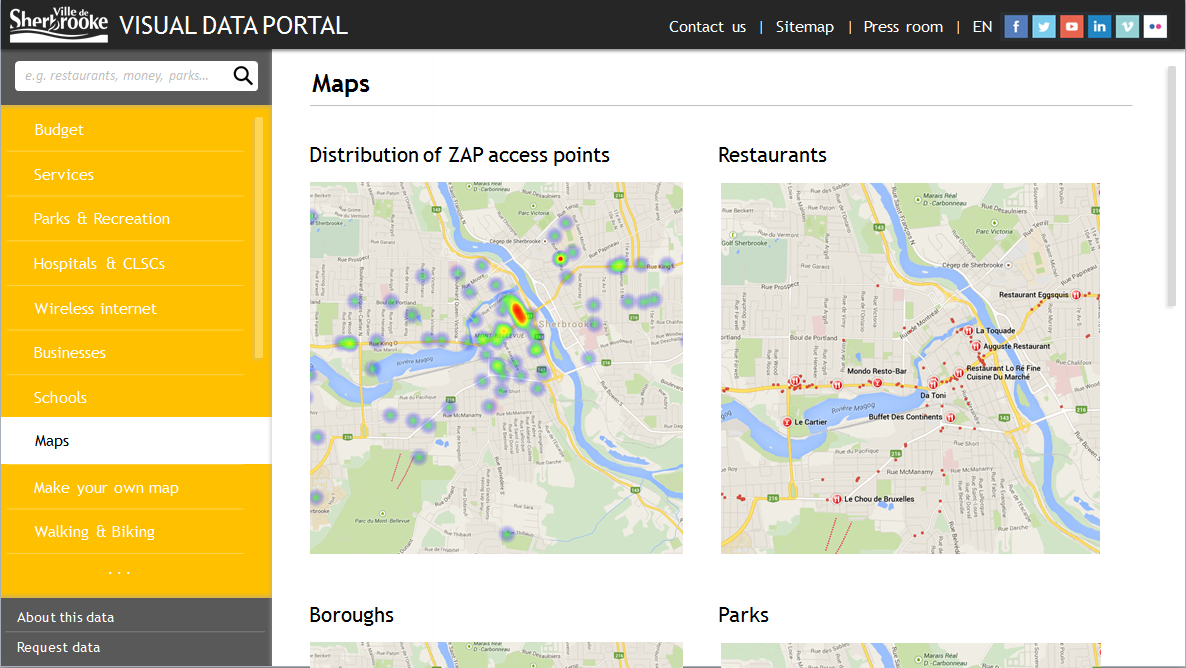
We scrape datasets available in the Sherbrooke Open Data portal (http://donnees.ville.sherbrooke.qc.ca/dataset), as well as other data freely available on the web, and then create live-updated graphs, charts, and other visualizations to make this data intuitive and easy to explore.
Datasets Used
ZAP, streets*, boroughs, murals & graffiti*, interesting sites*, pedestrian paths*, bike paths*, buildings*, parking lots*, parking meters*, parking pay-stations*, budget, projects, mayor's address.
*dynamically updated
Challenges I ran into
With a small team, we didn't have time to refine our app. But the underlying data is parsed, searchable, live-updateable, and graphable.
Accomplishments that I'm proud of
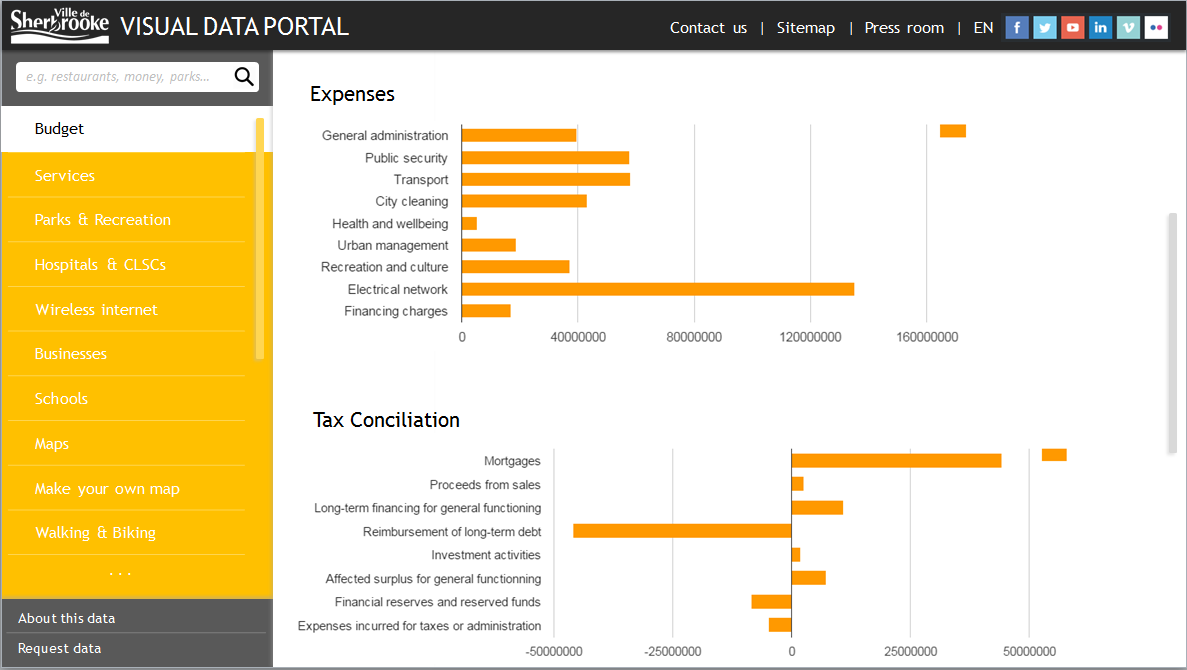
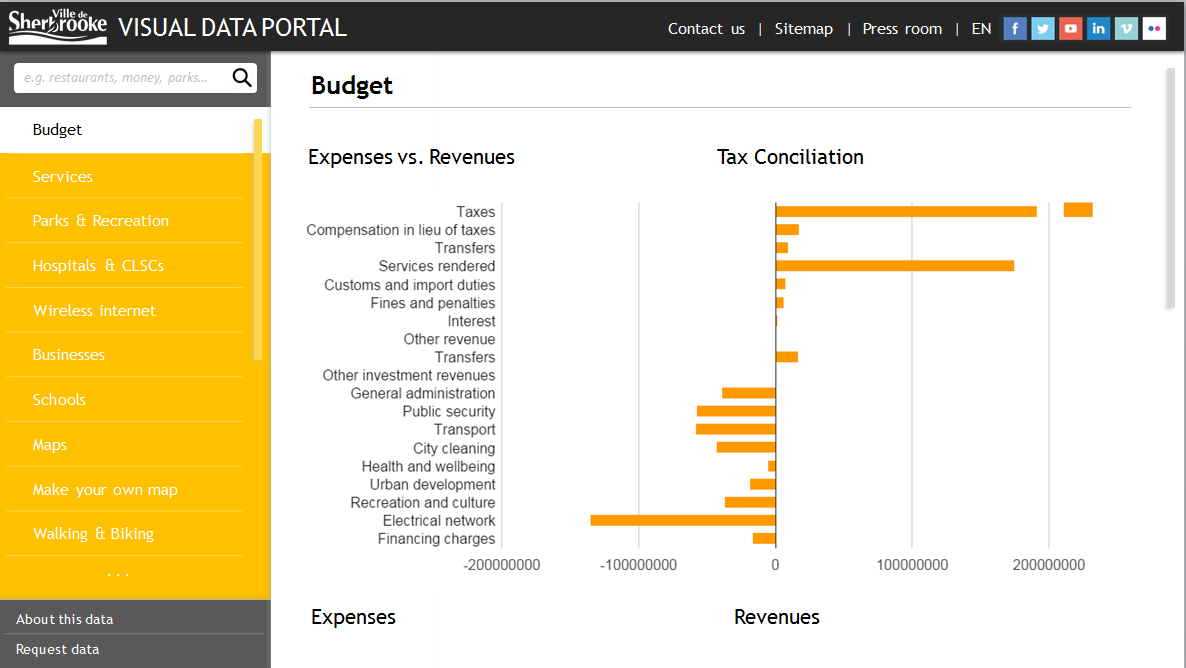
We're particularly happy with the manual and automatic parsing we did to make the budget searchable, graphable, and available in english. This information is very difficult to understand, and we hope to make it much more transparent to the public.
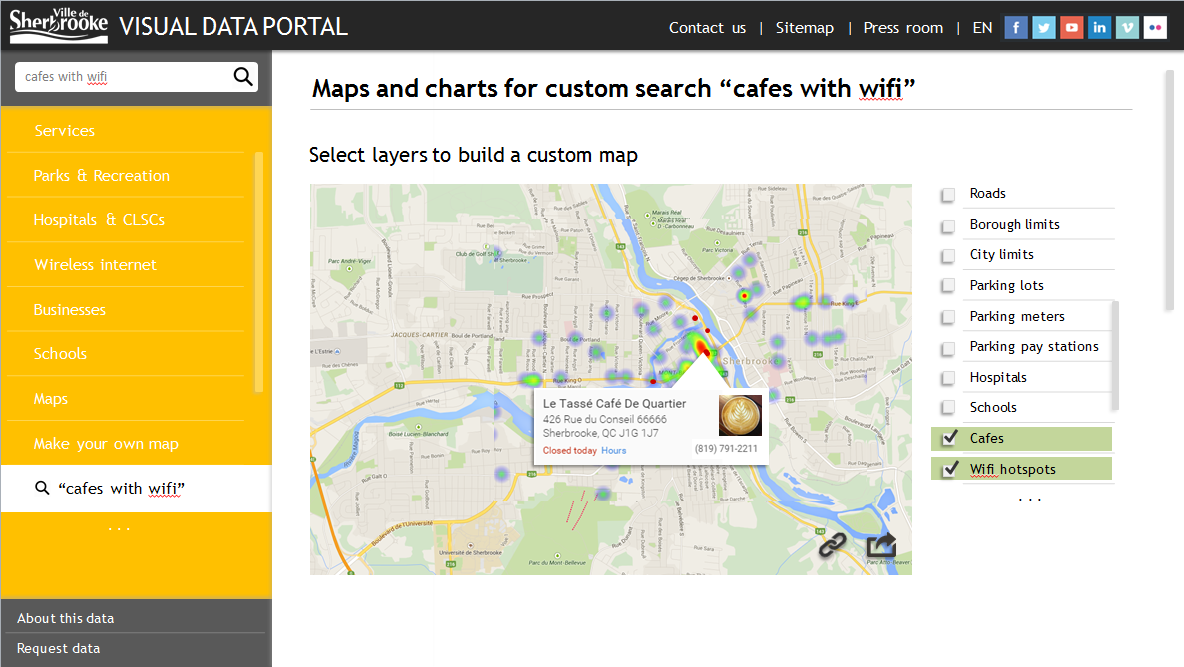
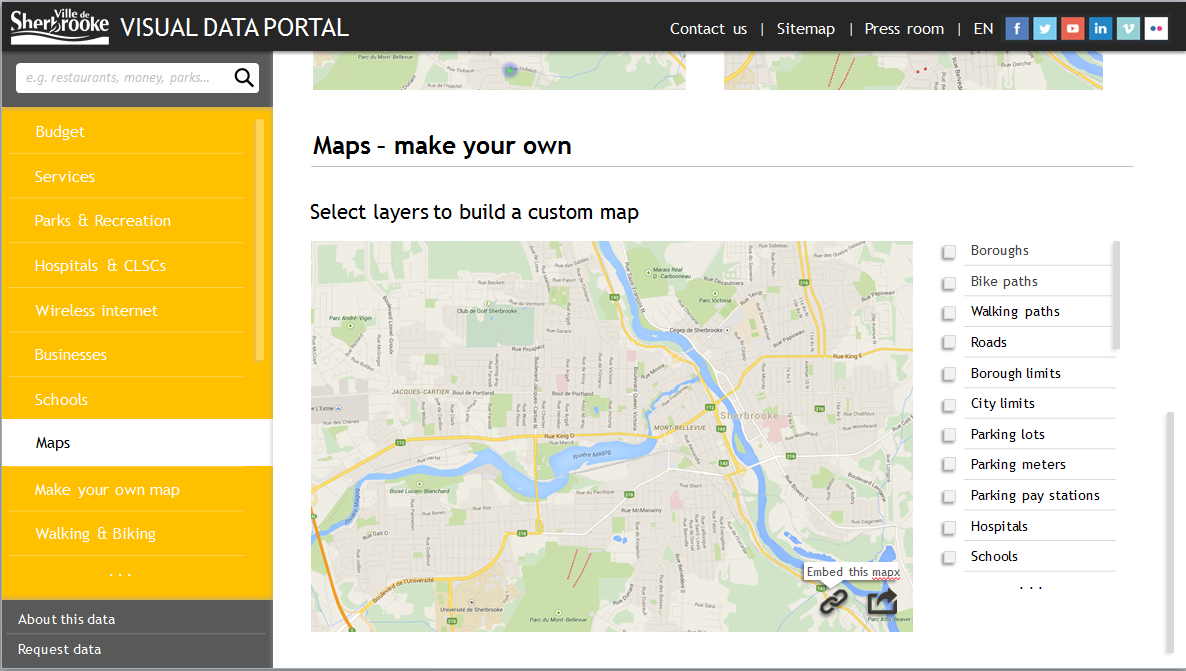
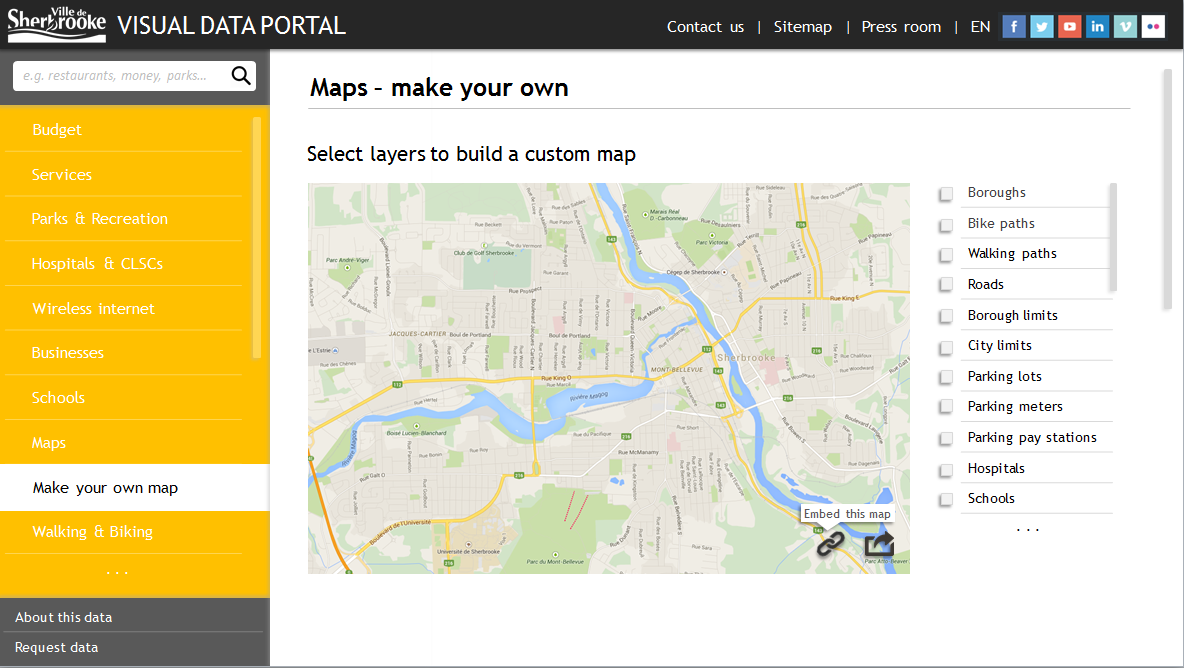
From a more technical point of view, we're very happy with how well our search function grabs tags for both charts and maps, and with the layering of kml maps and other data to create custom maps.
In the spirit of keeping things accessible, all of the search terms, keys, and titles are stored in both languages, so that switching the website from EN to FR is no problem.
What I learned
Visualizing data is hard! But we really believe that this is something that matters, worth putting time in to.
What's next for Thermos of Code
We'll continue to collaborate on innovative data visualization projects, while continuing with our own personal projects.
Built With
- chosen
- csv
- d3.js
- google-maps
- heatmap
- jquery
- knockout.js
- nvd3
- pandas
- pyminer
- web


Log in or sign up for Devpost to join the conversation.