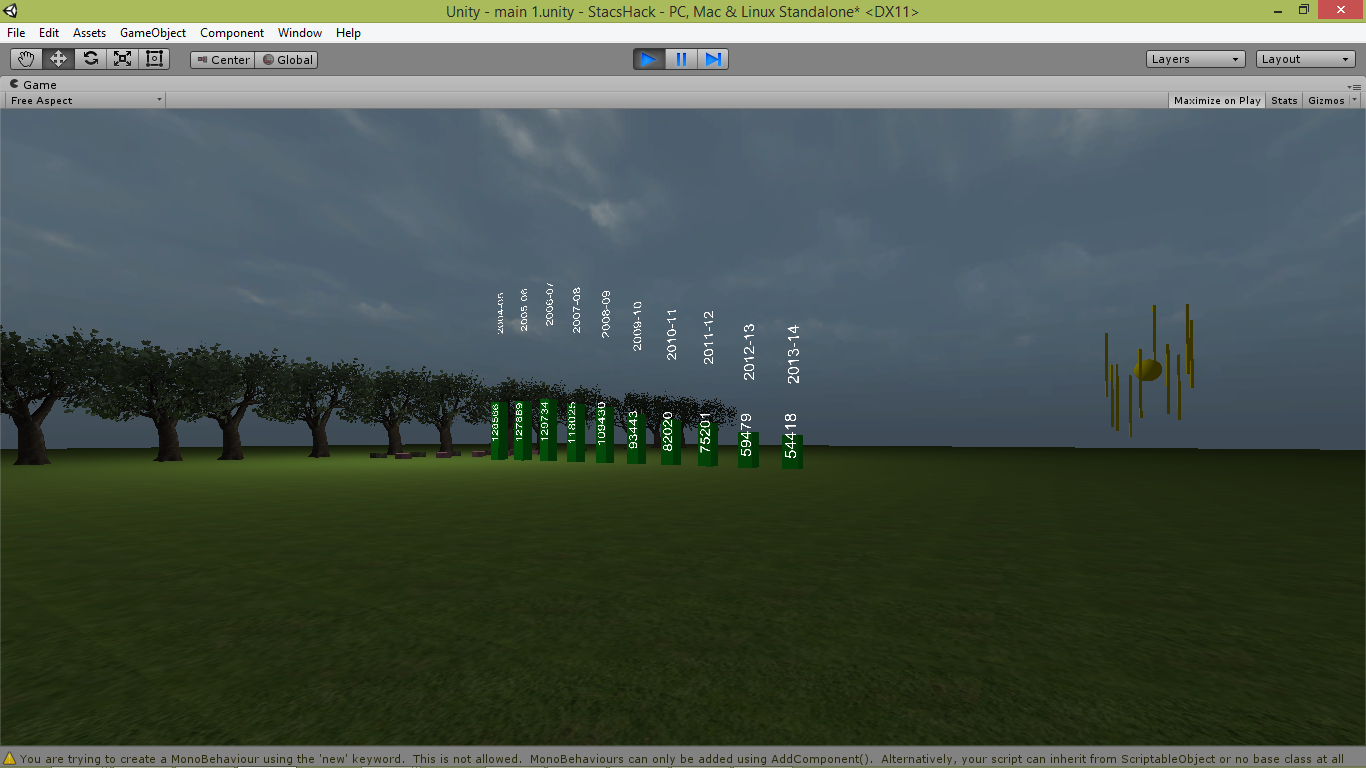
We wanted to see if it was possible to create an environment that the user could walk around in, select the data they wanted to see, and get a little bit of forecasting out of. As such, we used a highly limited data set from www.gov.scot/topics/statistics/browse/Crime-Justice - on total police figures from 2004-2014 to prove that we could interact with CSV files inside the environment, that we could display the data the user wished to see, and remove it as necessary. We also included a very basic forecast of the trends for the following year. Utilizing a trafficlight system that would light green for positive correlation between full time police numbers and crime decrease, yellow for potential correlation but unclear due to lack of data, and red for negative correlation.
We really wanted to take data viewing away from the usual browser based environment and give the user an area to walk around in and explore the data at their leisure in 3D.
We were most proud of getting the project working overall, as we have very little experience as a team with Unity 3D and C# but saw it as a great opportunity to enhance our skills and produce a Proof Of Concept.
//Due to upload restrictions our submission, as agreed by Nick, has been placed at the public onedrive location held within the website section of this electronic submission//

Log in or sign up for Devpost to join the conversation.