
You can find all of our code on github
The Problem
The Department of Labor has a problem analyzing their data. They would like to be able to predict labor violations, yet unfortunately lack quality data with which to make meaningful predictions. We partially address the problem by utilizing a complementary dataset to substantially enhance our features.
The Data
WHD
The WHD (Wage and Hour Compliance Action Data) dataset consists of a single csv file with 188,000 records. This may seem like a lot, but there are many types of violations hiding in this file. In addition, most of the text fields suffer from poor data entry and data normalization practices. To address these issues, we decided to narrowly focus our efforts on one type of violation - the H1B visa violation. Only a small fraction, 1552, of the investigations resulted in an H1B violation. However, the small sample size is outweighed by the availability of copious amounts of supplementary data on the H1B visa program.
LCA (Labor Condition Application) / H-1B
In order to enhance the usefulness of our data, we decided to merge the H1B visa application data into the WHD dataset. This is a much better dataset (although still beset by data entry issues), containing wage, position, and application data for every visa filing made since 2008. Due to inconsistent data format issues, we decided to restrict our merge to visa applications from 2010 onwards. There were about 2,000,000 applications cataloged in the LCA database for these years.
The Merge
By far the most difficult part of our project was merging the two datasets together. There is no unique company identifier in either dataset, so we were forced to use the company name as a primary key. In addition to having two names for each company in the WHD dataset, both datasets suffer from both typos and inconsistencies in the naming. To address this, we wrote a fairly elaborate name normalization system that strips out common suffixes, as well as punctuation and whitespace, before using Levenshtein distance to compare two names (threshold for a match - 0.92 ratio). While there are some false positives, the rate is acceptably small and basically unavoidable.
whitespace_re = re.compile(r'\s')
suffix_re = re.compile(r'INC$|LLC$|INCORPORATED$')
bad_words_re = re.compile(r'GROUP|DISTRICT|CORPORATION|CORP')
def normalize_name(name):
  name = name.upper()
  name = name.translate(string.maketrans("",""), string.punctuation)
  name = whitespace_re.sub(' ',name)
  name = suffix_re.sub('',name)
  name = bad_words_re.sub('',name)
  name = name.strip()
  return name
Even with a decent string comparison function, actually comparing approximately 160,000 names from the WHD dataset to around 200,000 from the LCA dataset is obviously intractable with a brute force solution. We solved this problem by building a lookup table to decide what to compare, based on the first word in the company name. If the word didn't match, we didn't compare. This approach has obvious issues, but is quite fast.
After building the index, we were able to filter the datasets against each other. We identified 600,000 visa applications from companies that were investigated, and 3,100 investigations of companies that filed at least one visa application. Progress!! We believe that both of these numbers understate the true prevalence due to errors in our matching system, but they are probably within 10%.
Feature Engineering
We had a few hypotheses we wanted to test in order to identify suspicious behavior. In order to test these, we built a feature vector for each company in both the violation and visa dataset.
- Are larger companies more likely to violate? We used total visa applications to investigate.
- Do cheaper companies commit more violations? We look at a bunch of salary features - average lower and upper bound on the wage, the prevailing wage determination, and some ratios.
- Do companies with more rejected or withdrawn visa applications relative to their total violate? We look at the percent of applications with each outcome.
- Are certain industries a problem? We look at NAICS (Industry Name) and most common job type.
- Do some geographies violate more frequently than others? We investigated rates across different states.
Conclusions
All in all, we found visa applications from 269 violators. Presumably, the rest of them were from visa application years that we didn't investigate or name matching errors. With these, and the 2,814 matching investigated companies with no H-1B violations, we could finally make some predictions. What is the best predictor of violations in an investigation?
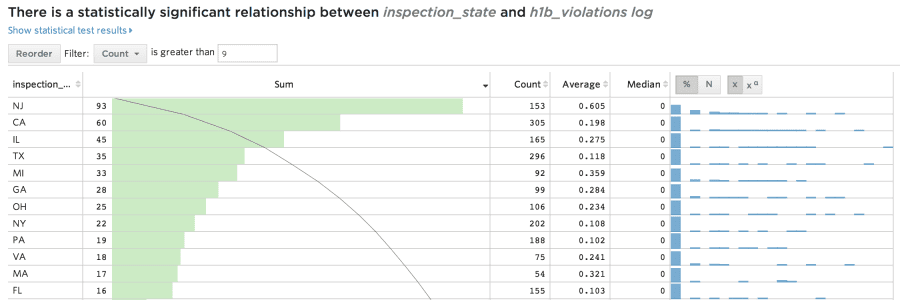
New Jersey! Nearly 50% of investigations into New Jersey companies resulted in violations. This is by far the worst rate of any state, clobbering California's measly 12% violation rate. Clearly, clubbing and spray tans are not a great way to learn labor ethics.
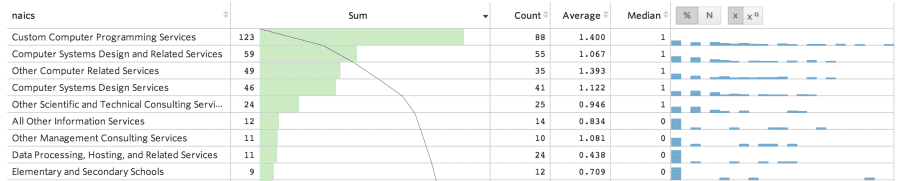
Looking at industry, our ANOVA calculation was unable to provide statistical significance due to the large number of options, but inspection reveals that software consulting is a common culprit.
We expected to find that denied and withdrawn applications indicated a questionable employer, however much to our surprise neither of these things seem to matter very much. Proportionally more withdrawn applications are slightly indicative of violations, but it’s really small.
Wage rate also is a statistically significant predictor of recidivism (although weaker than the above two). Lower wage applications, measured against any of our salary metrics, are more likely to lead to or indicate violations. The correlation isn't very strong, but the salary data is interesting independently.
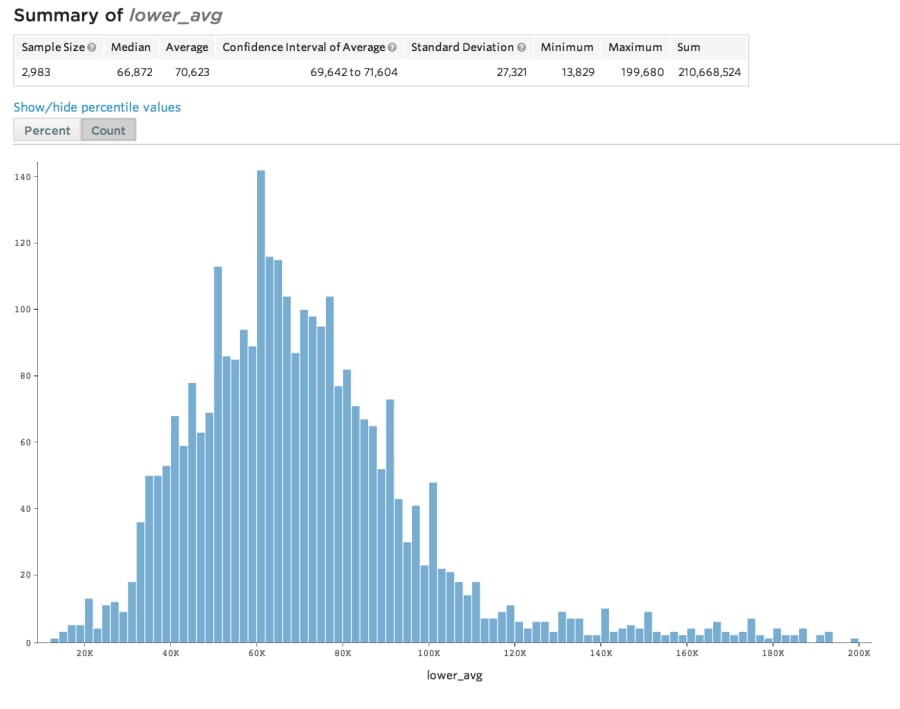
This histogram shows the average lower salary bound for our visas. All H-1B visa applications include two wage numbers, indicating the lowest and highest salary the employer is willing to pay. These numbers are legally binding, without filing a new visa application you can't cut pay or raise pay outside the range.
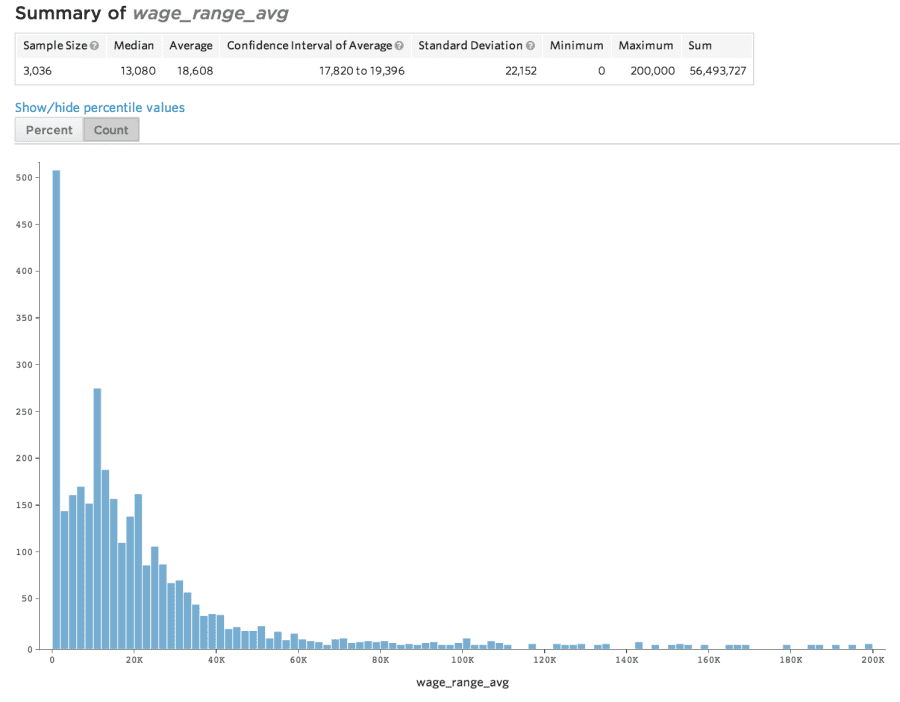
The wage range is the difference between these lower and upper salary bounds. Higher ranges indicate more lucrative positions, and correspondingly we find higher ranges to be less indicative of violations.
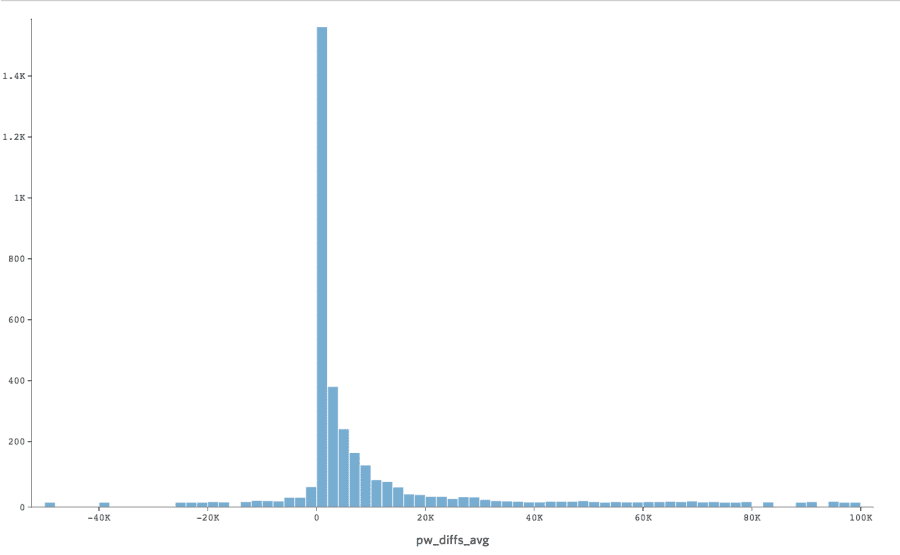
Yet another salary concept from the wonderful world of visas is the Prevailing Wage. Employers are not allowed to pay an H-1B candidate less than the prevailing wage for that occupation in the US. This graph shows the difference between the lower bound salary and prevailing wage determination. Usually, employers request a minimum salary at or slightly above the prevailing wage. Those who don't are more likely to lose their application, so it's fairly rare to request less. Violations of the prevailing wage regulations are probably the source of most H-1B issues.
Future Work
Pursuing this project has uncovered glaring issues in the Department of Labor open data sources. Further work without addressing these issues is almost pointless. By far the most important thing to improve is the original source data. That being said, there are lots of additional data sources that theoretically can bridge the gap between our existing predictions and an actually useful model. Every company has a record in some database, and many of these are vastly superior to the surveyed datasets. Some examples: EDGAR, Crunchbase, or even state incorporation filings. It's very likely that predictive features are hiding in plain site / behind the lack of a good primary key like EIN or D&B Number.
PSA
Get on Hired and benefit from data driven recruiting! Such transparent. Very salary.


Log in or sign up for Devpost to join the conversation.