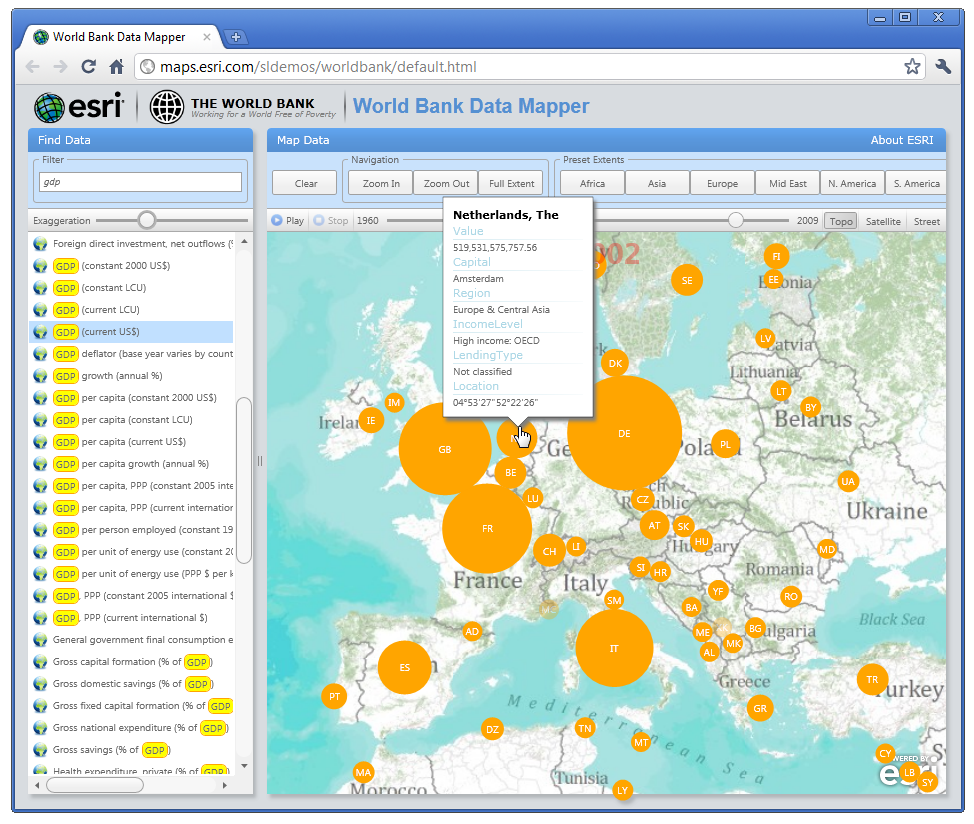
(This submission is not eligible for awards due to its maker being a World Bank vendor, but you may show your appreciation for it by voting.) The World Bank Data Mapper is a Silverlight-based web application that can map any one of the 3,000+ economic/financial/health indicators for the entire world. The web application does not include any canned data. All data is dynamically downloaded using the World Bank Indicator API. How to use: As soon as the application has finished downloading the list of indicators and countries, click on a preset region like Africa or Asia, Click any one of the 3,000+ indicators, the data download may take a few seconds, Click the play button (or slide the time slider) to view the data changes over time(if necessary you may need to adjust the dot size using the exaggeration slider)
The web application uses Esri's ArcGIS API for Silverlight and the Farseer Physics Engine. The physics engine prevents dots from overlapping hence making disparity between small and large values obvious and compelling. The attached video displays "Estimate Aids death over time" for the continent of Africa. This application was developed by the Applications Prototype Lab at Esri in Redlands, California.

Log in or sign up for Devpost to join the conversation.