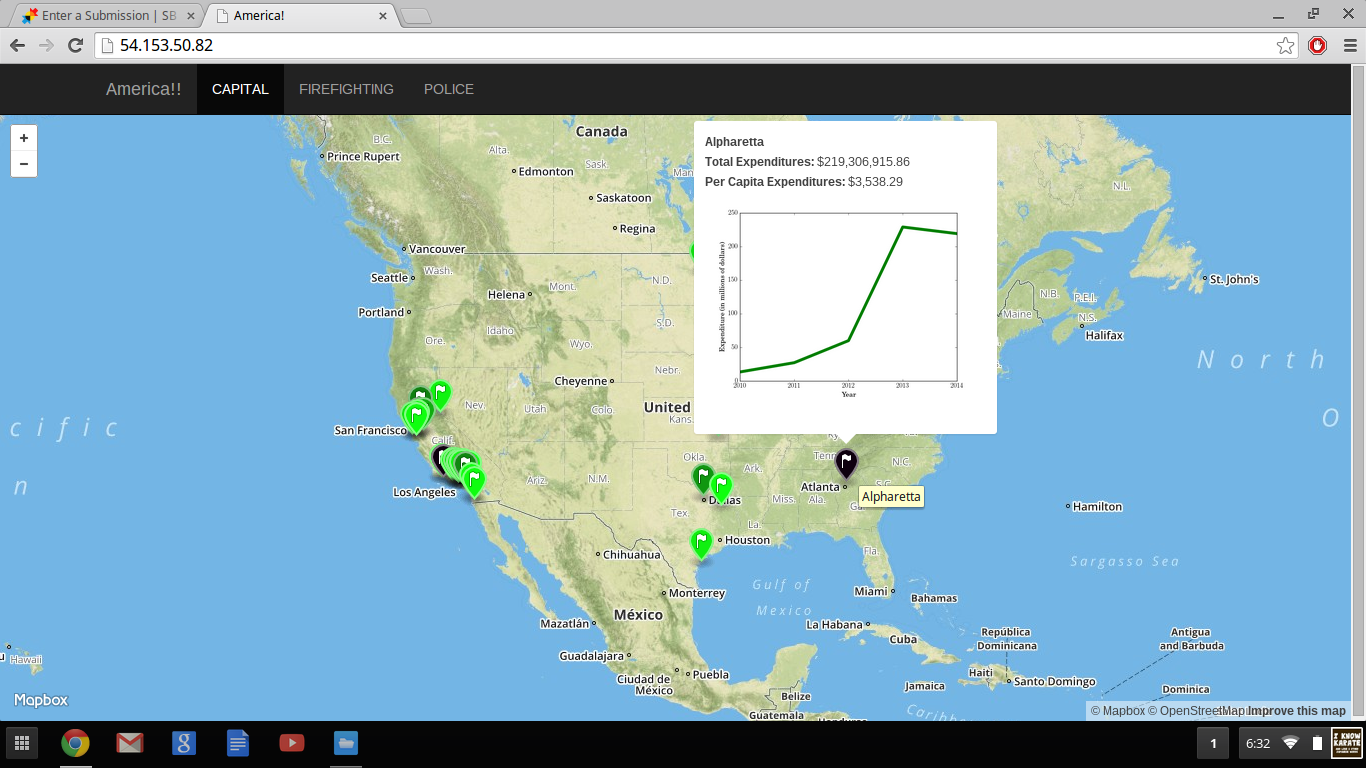
OpenGov provides a rich dataset of government financial information. Datasets that have been organized and cleaned are extremely difficult to come by for free and we were excited at the prospect of playing with "real" data. Our goal was to make make a publically available visualization tool to promote a public understanding of how local governments spend our money.
We focused on three areas of spending: capital improvements (building infrastructure), police departments (for law enforcement) and fire department (for health and safety). Each section includes clickable icons to view current financial data and trends.
We would like to thank OpenGov for their making this data publicly available and easily parsable in JSON and .csv files. With any luck, this sort of website can pave the way for more government transparency as people begin to explore the various apps and realize how they can shape the way we interact with our governments.
While we were able to accomplish some very modest goals in this project, a few further goals we'd like to tackle are: 1. Querying the given JSON using natural language processing so as to more accurately categorize the ledger data into our three categories, 2. Drawing our graphs better in matplotlib and 3. Tweaking the design of the webpage to make it more user friendly.
Built With
- amazon-web-services
- apache
- css
- html
- javascript
- mapbox
- matplotlib
- opengov
- python

Log in or sign up for Devpost to join the conversation.