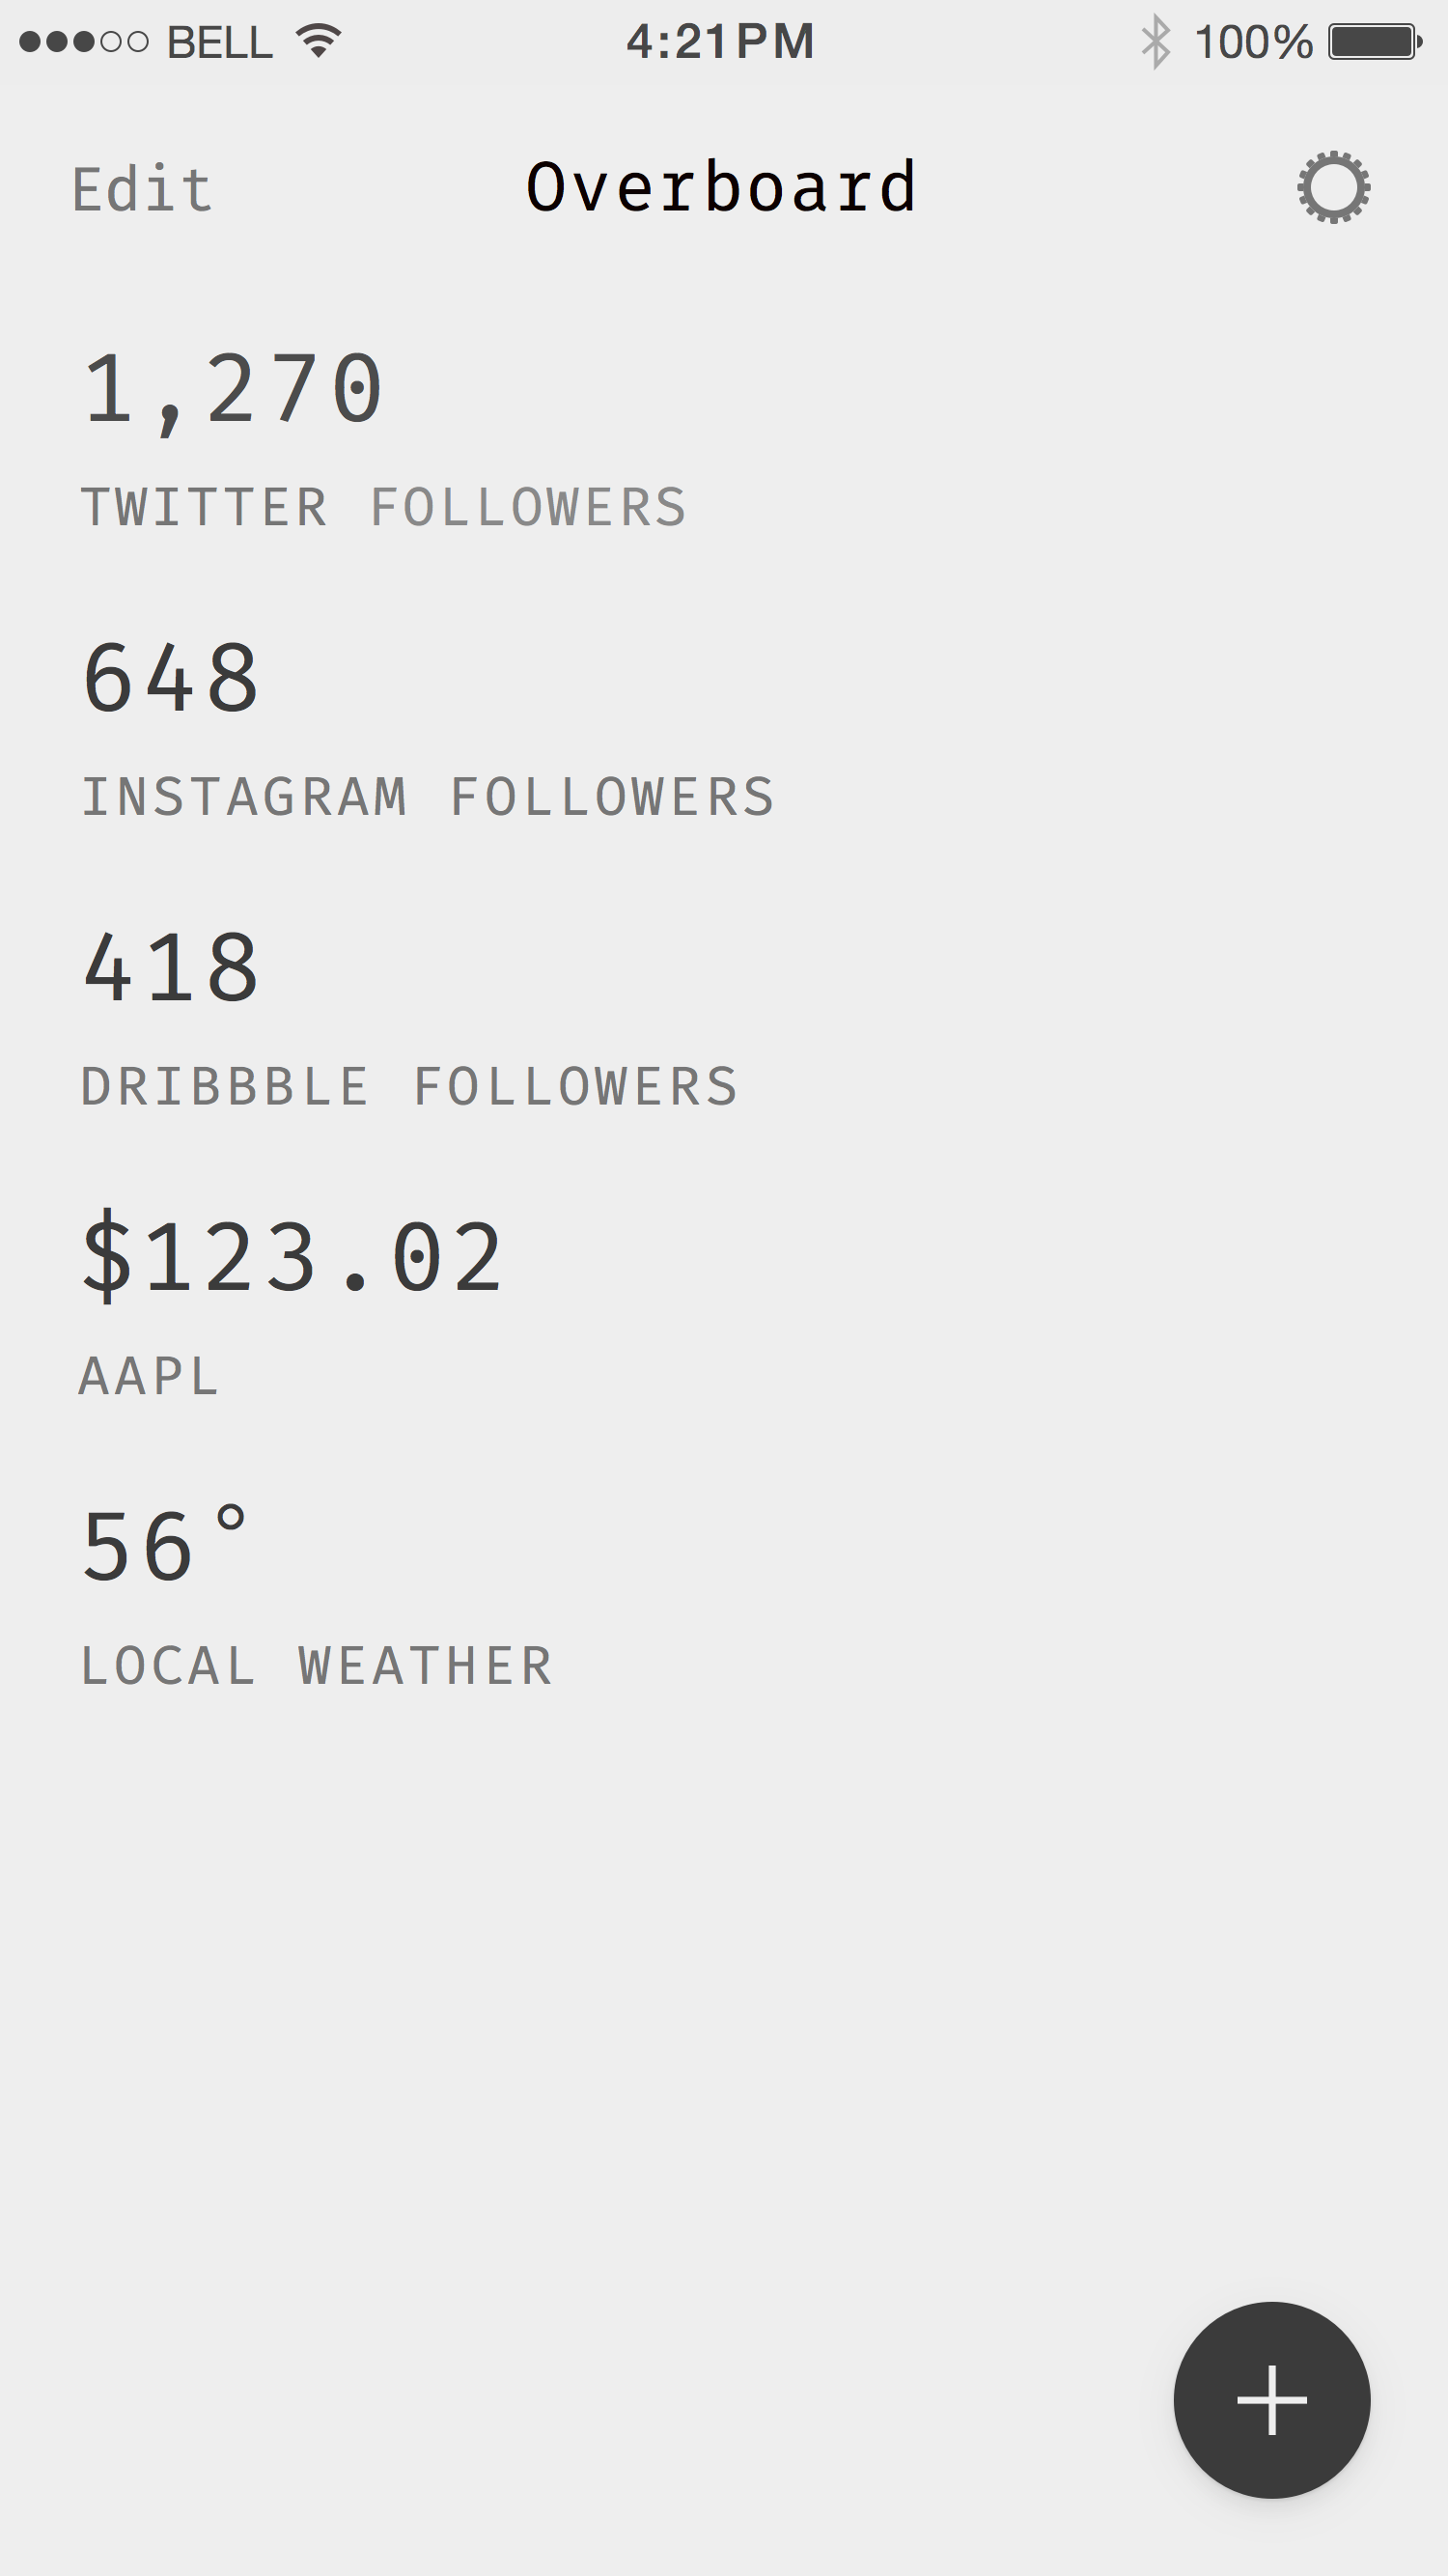
API's contain incredibly valuable information. Often times they provide a number that gives an overview of some statistic, for example number of users or a stock price. With Overboard, you can gather all of these endpoints into one simple overview and dashboard. Check your Twitter followers at a glance, see what the top product on Product Hunt is for the day, get a stock price, check the number of users for your startup, the possibilities are endless. If you have an API for it, you can Overboard it.
We built Overboard because there are so many different things we keep track of on a daily basis, and they are all in separate places. Combining these all into one convenient overview was a natural fit.
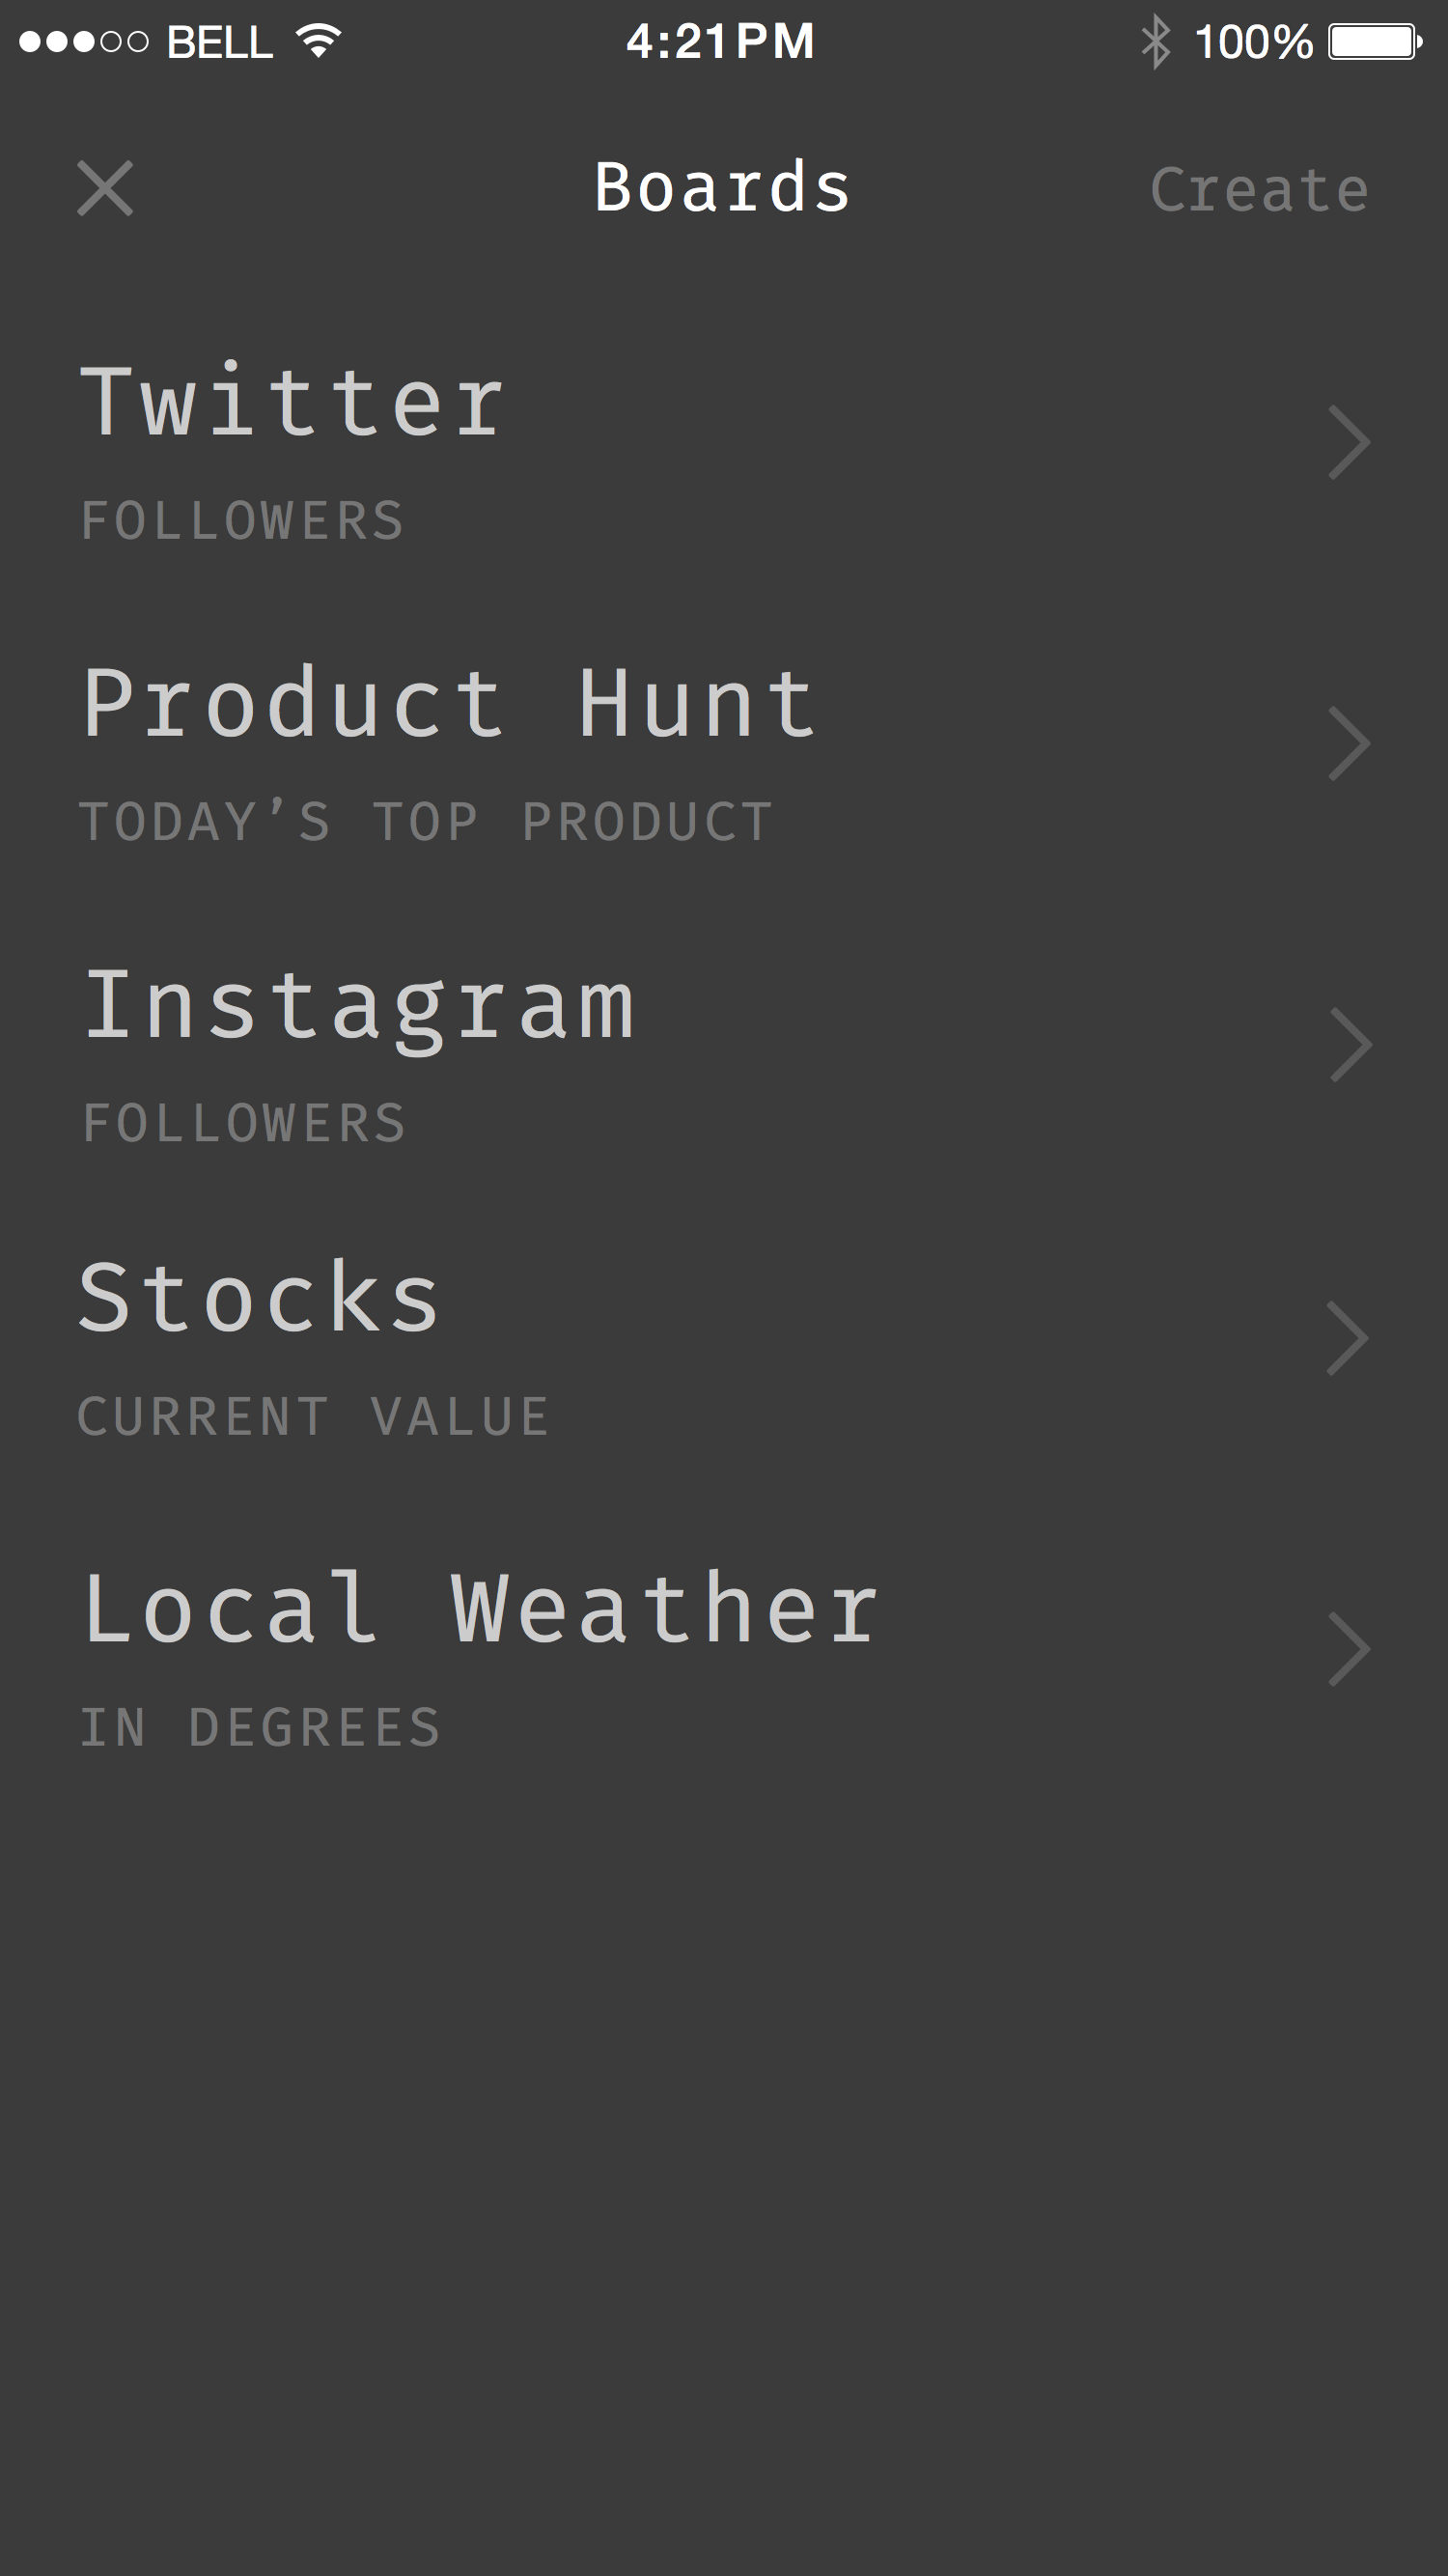
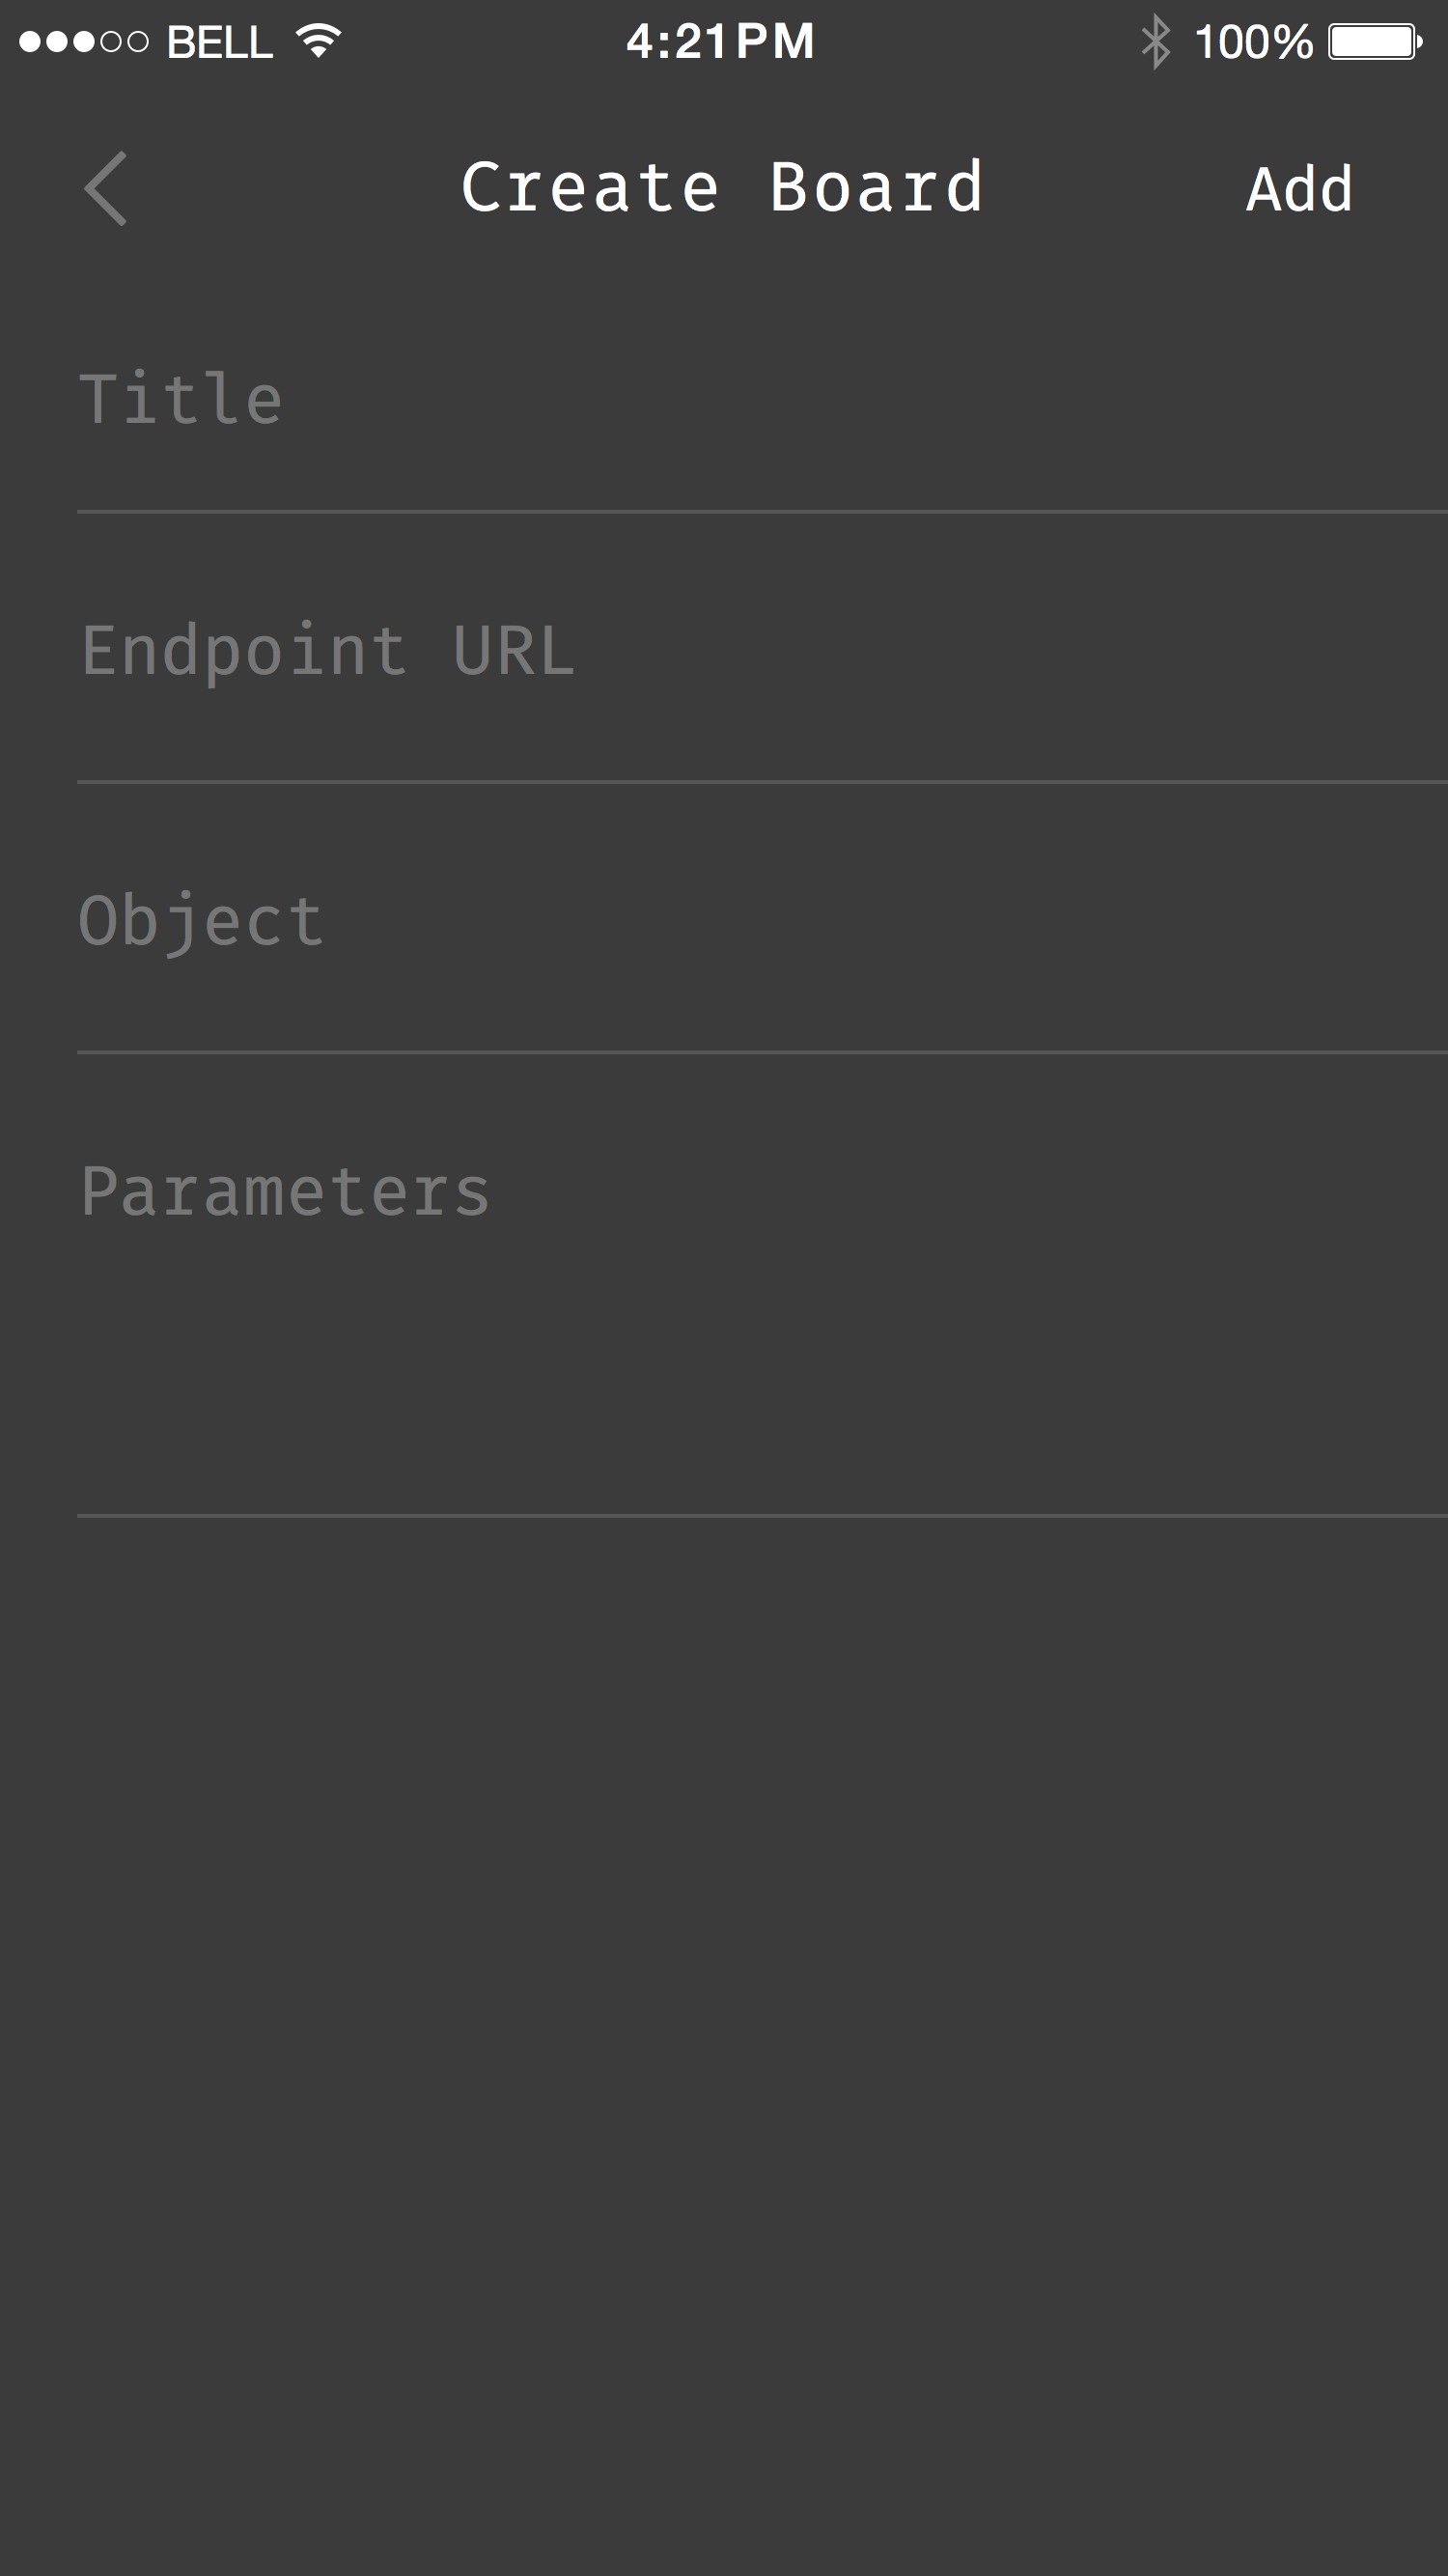
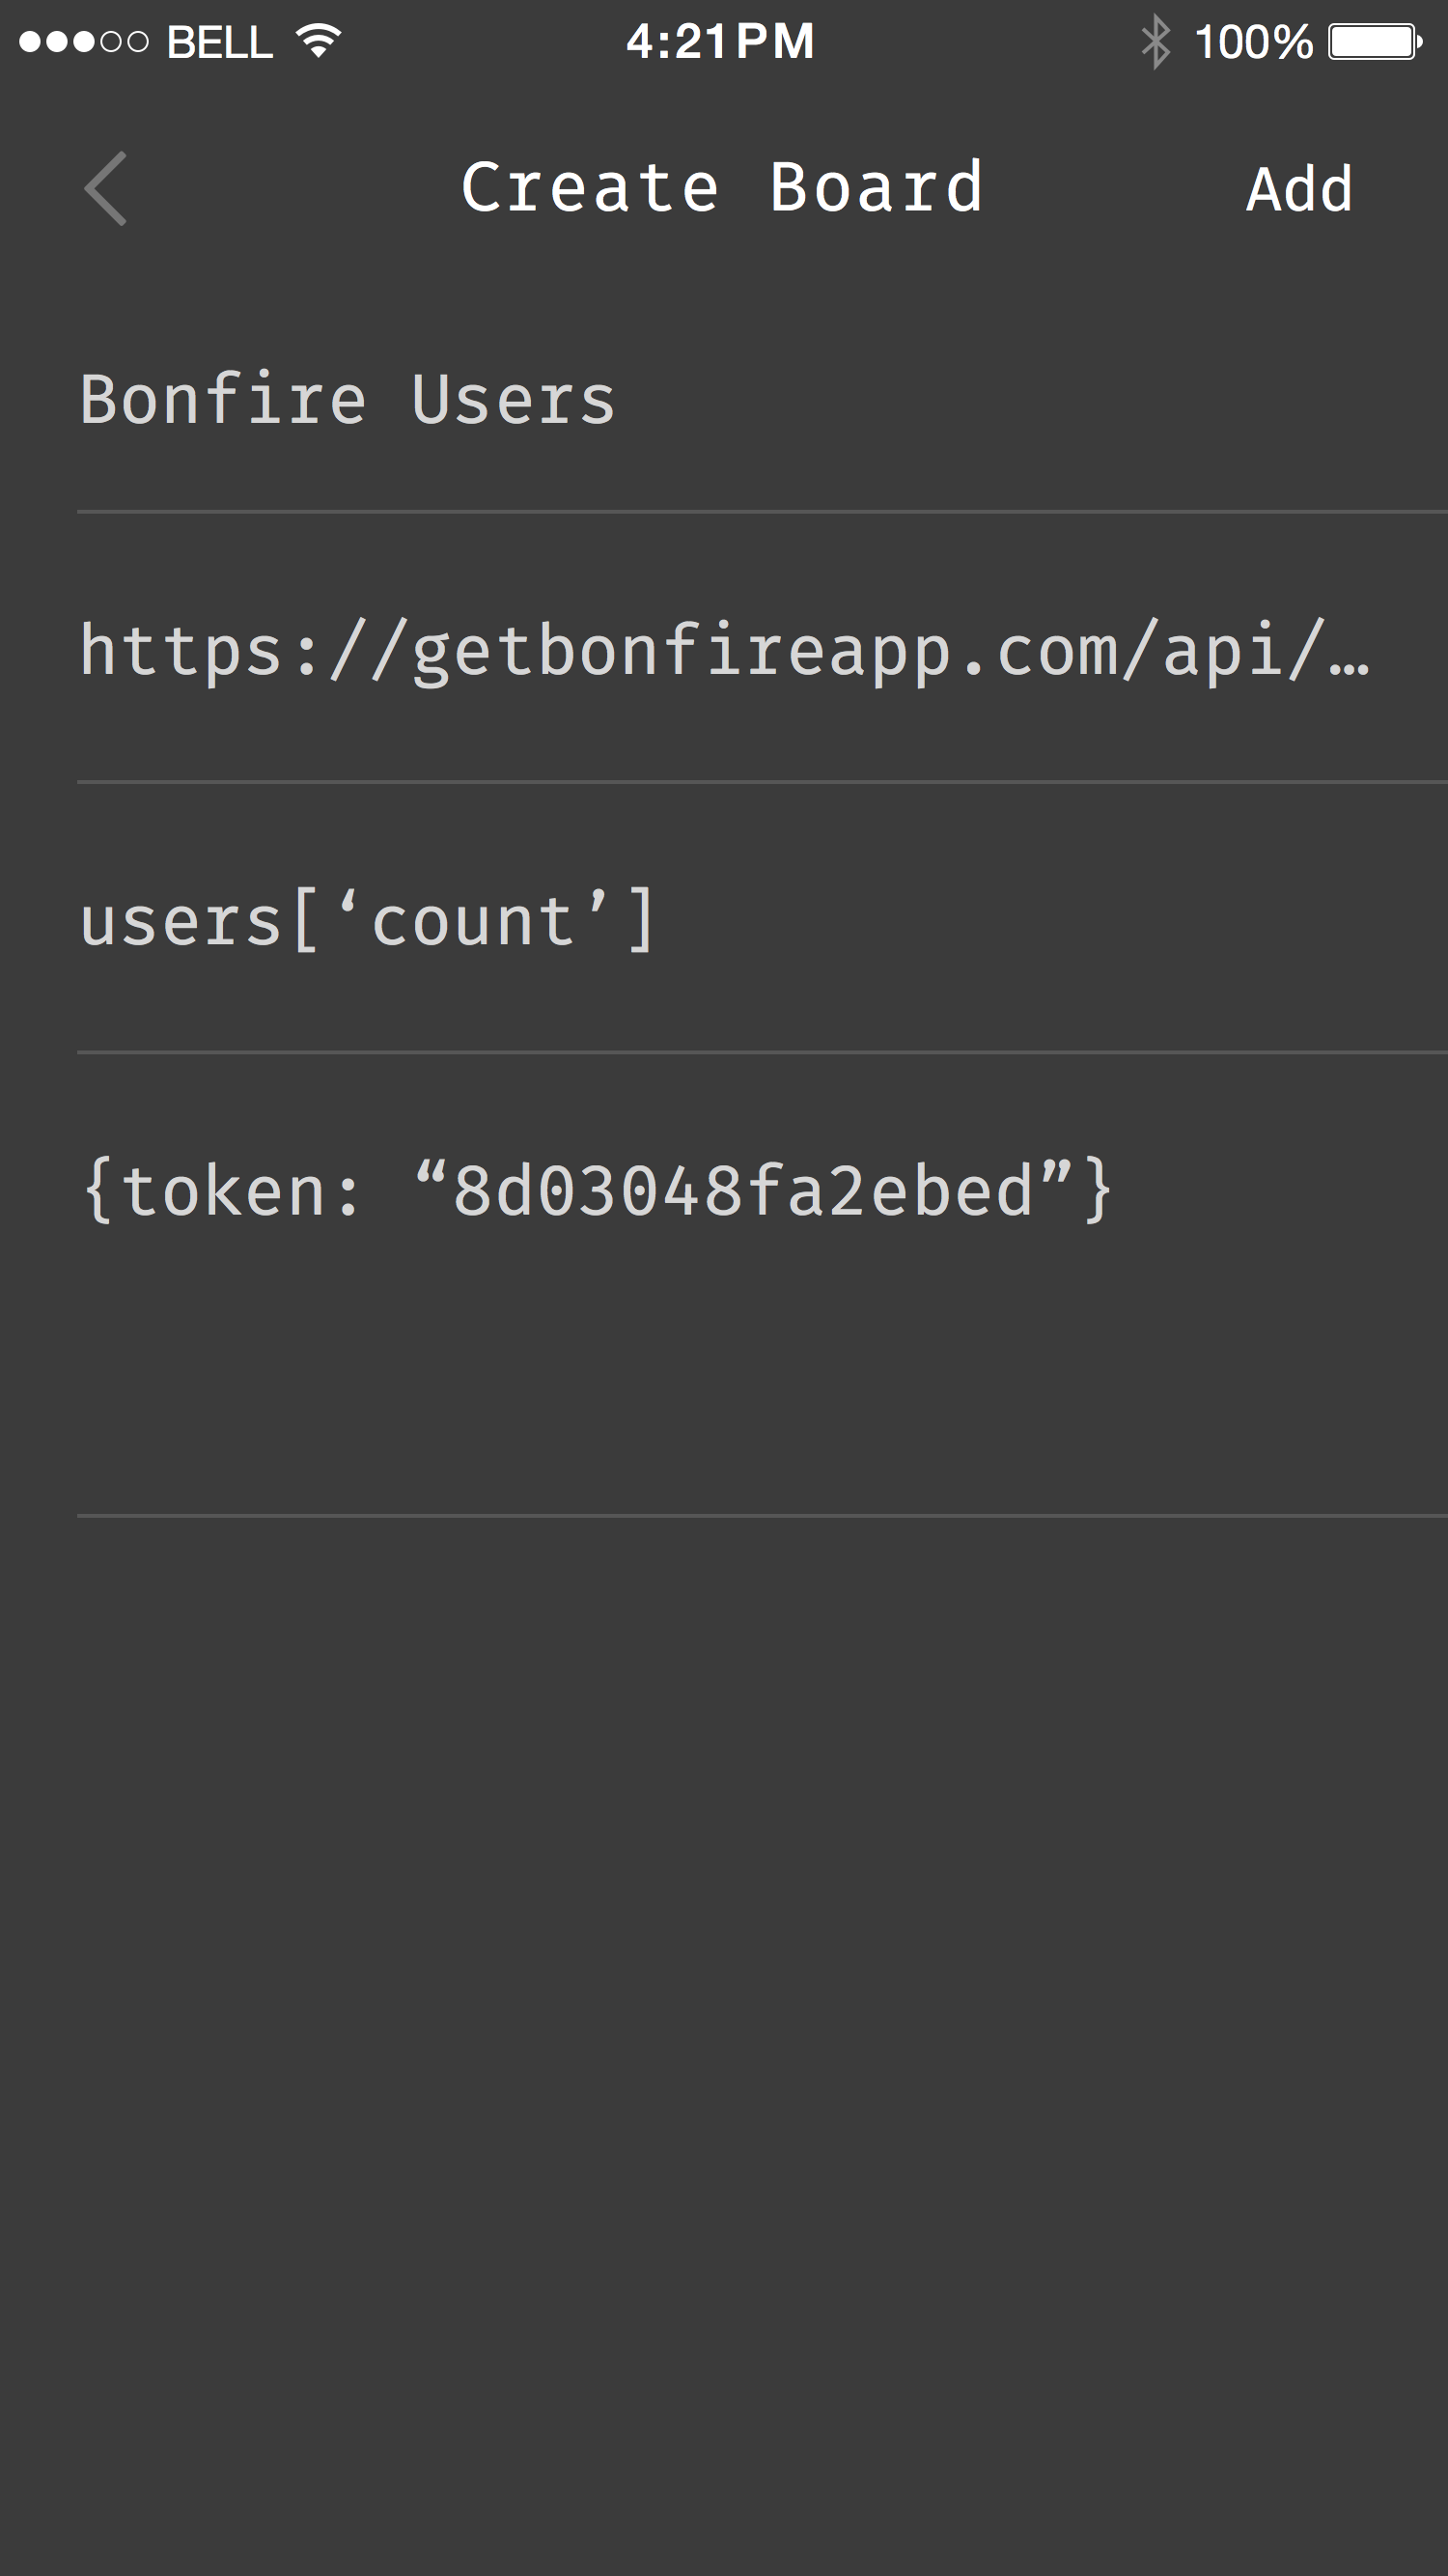
We provide you with a great set of cards built in so that you can track many popular social network follower counts, get a stock price or see what the weather is. Have a custom API endpoint you want to keep track of? Just give it a title, enter the endpoint URL, give us the object in the array that the info is located, and provide some parameters if need be.


Log in or sign up for Devpost to join the conversation.